%EF%B9%96width=1360&height=768&name=image%20(10).jpg)
In Part 1: Resource Saturation, we covered the resource saturation alerts that often serve as early warning signs — CPU, memory, disk I/O, and storage. If you haven’t read it yet, it’s worth starting there before diving into this guide.
Now we move to the next pillar: cluster service health. Where resource saturation tends to creep up gradually, the alerts here can mean immediate service impact: FE or BE nodes going offline, JVM exhaustion, metadata corruption, compaction backlogs. Knowing what to look for, and what to do when an alert fires, is the difference between a five-minute fix and a two-hour incident.
For a complete walkthrough on setting up Prometheus and Grafana with StarRocks, including installation, dashboard templates, and alert rule configuration, see the official monitoring and alerting documentation.
Part 2: Cluster Service Health
Here’s a quick overview of what this guide covers and how severe each alert type is:
|
Alert |
Section |
Severity |
|---|---|---|
|
FE Service Down |
1 |
🔴 Critical |
|
BE Service Down |
1 |
🔴 Critical |
|
JVM Memory Exhaustion |
2 |
🟡 Warning |
|
Checkpoint Failure |
3 |
🟡 Warning |
|
Excessive FE Thread Count |
4 |
🟡 Warning |
|
Compaction Failure |
5.1 |
🟡 Warning |
|
High Compaction Pressure |
5.2 |
🟡 Warning |
|
Excessive Tablet Version Count |
5.3 |
🟡 Warning |
1. Service Downtime (🔴 Critical)
FE Service Down
PromQL
count(up{group="fe", job="$job_name"}) <3🚨 Alert condition:
An alert is triggered when the number of active FE nodes falls below the configured threshold.
You can adjust this threshold based on the actual number of FE nodes in the cluster.
🧰 Troubleshooting:
🔎 Common Cause 1 — Clock Desynchronization Between FE Nodes
If the time difference between FE nodes exceeds 5 seconds, the service may fail to start.
Example error:
Caused by: com.sleepycat.je.EnvironmentFailureException:Environment invalid because of previous exception:Clock delta: -6146 ms
How to fix:
Synchronize the system clocks across FE nodes and restart the FE service.
🔎 Common Cause 2 — Insufficient Disk Space for Metadata
If the disk storing FE metadata has less than 5 GB of free space, FE may fail to start.
Example log in fe.log:
com.sleepycat.je.DiskLimitException:Disk usage is not within je.maxDisk or je.freeDisk limitsand write operations are prohibited
How to fix:
Expand the disk where the metadata directory resides.
The BDB metadata service requires more than 5 GB of free disk space to start properly.
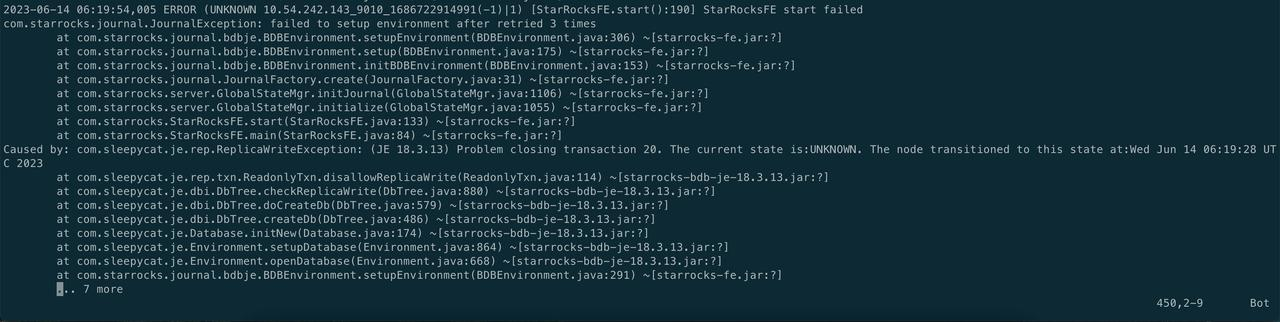
🔎 Common Cause 3 — Exceptions During Journal Replay
Example error:
catch exception when replaying journal, id: 310080247
com.starrocks.journal.JournalInconsistentException: failed to load journal type 210
How to fix:
Add the problematic journal ID to the FE configuration and attempt recovery:
metadata_journal_skip_bad_journal_ids=310080247You should also submit an issue on GitHub for further investigation.
🔎 Common Cause 4 — Unknown Operation Type During Replay
Example error:
Caused by: java.io.IOException: UNKNOWN Operation Type 10005
How to fix:
1. Stop all FE nodes.2. Back up the metadata directory (meta_dir) on all FE nodes.
3. Add the following configuration to fe.conf on all FE nodes:
metadata_ignore_unknown_operation_type = true5. If everything is correct, create a new metadata image:
ALTER SYSTEM CREATE IMAGE;6. After the new image is synchronized to the meta/image directory on all FE nodes, remove the configuration:
metadata_ignore_unknown_operation_type = trueThen restart all FE nodes again.
For other causes, refer to the official documentation: https://docs.starrocks.io/docs/3.3/administration/Meta_recovery/
⚠️ Emergency Handling:
If only one non-leader FE node fails, you can temporarily:
- Remove the node from the load balancer.
- Repair or rebuild the node.
- Rejoin it to the cluster through standard scaling procedures.
BE Service Down
PromQL
node_info{type="be_node_num", job="$job_name", state="dead"} > 1
🚨 Alert condition:
An alert is triggered when more than one BE node becomes unavailable.
🧰 Troubleshooting:
🔎 Common Cause 1 — Tablet Metadata Load Failure
If BE fails to start due to tablet metadata loading errors, check the logs:
# Check whether the following error appears in the logs:grep -a 'load tablets encounter failure' be.INFO# Check whether the following error appears in the logs:grep -a 'there is failure when scan rockdb tablet metas' be.INFO
If the error there is failure when scan rockdb tablet metas does not appear, perform the following steps:
Add the following configuration to the be.conf file:
ignore_load_tablet_failure = trueAfter saving the configuration, restart the BE service.
🔎 Common Cause 2 — Disk Failure
Typical error message:
store read/write test file occur IO Error. path=How to fix:
Remove the faulty disk from storage_root_path and restart the BE node.
⚠️ Note: If a table only has a single replica on that disk, the data will be lost.
🔎 Common Cause 3 — Query Triggered a BE Crash
Sometimes a specific query may trigger a bug that causes a BE crash.
The be.out log usually contains the corresponding query_id.
Example crash log:
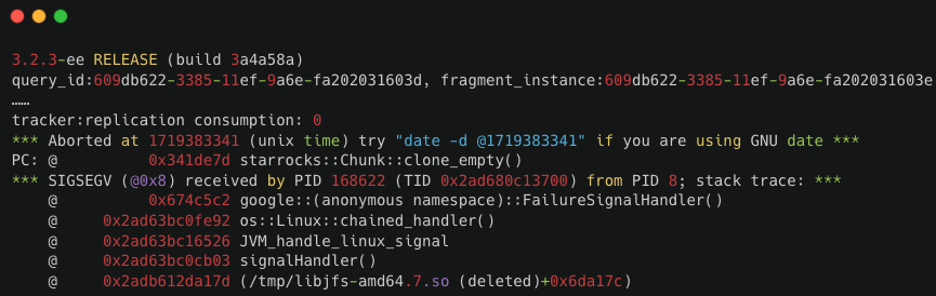
How to fix:
If the same SQL query repeatedly triggers the crash, you can add it to the SQL blacklist. Note that the blacklist configuration must be added to multiple FE nodes.
Enable the blacklist:
ADMIN SET FRONTEND CONFIG ("enable_sql_blacklist" = "true");
Add a rule: ADD SQLBLACKLIST "sql";
For example:
ADD SQLBLACKLIST "select\s+(.*)from\s+${table_name}";
2. JVM Memory Exhaustion (🟡 Warning)
PromQL
(sum by(instance) (jvm_heap_size_bytes{type="used"}))/ (sum by(instance) (jvm_heap_size_bytes{type="max"})) * 100 > 90
🚨 Alert condition:
An alert is triggered when the JVM heap usage on an FE node continuously exceeds 90%.
🧰 Troubleshooting:
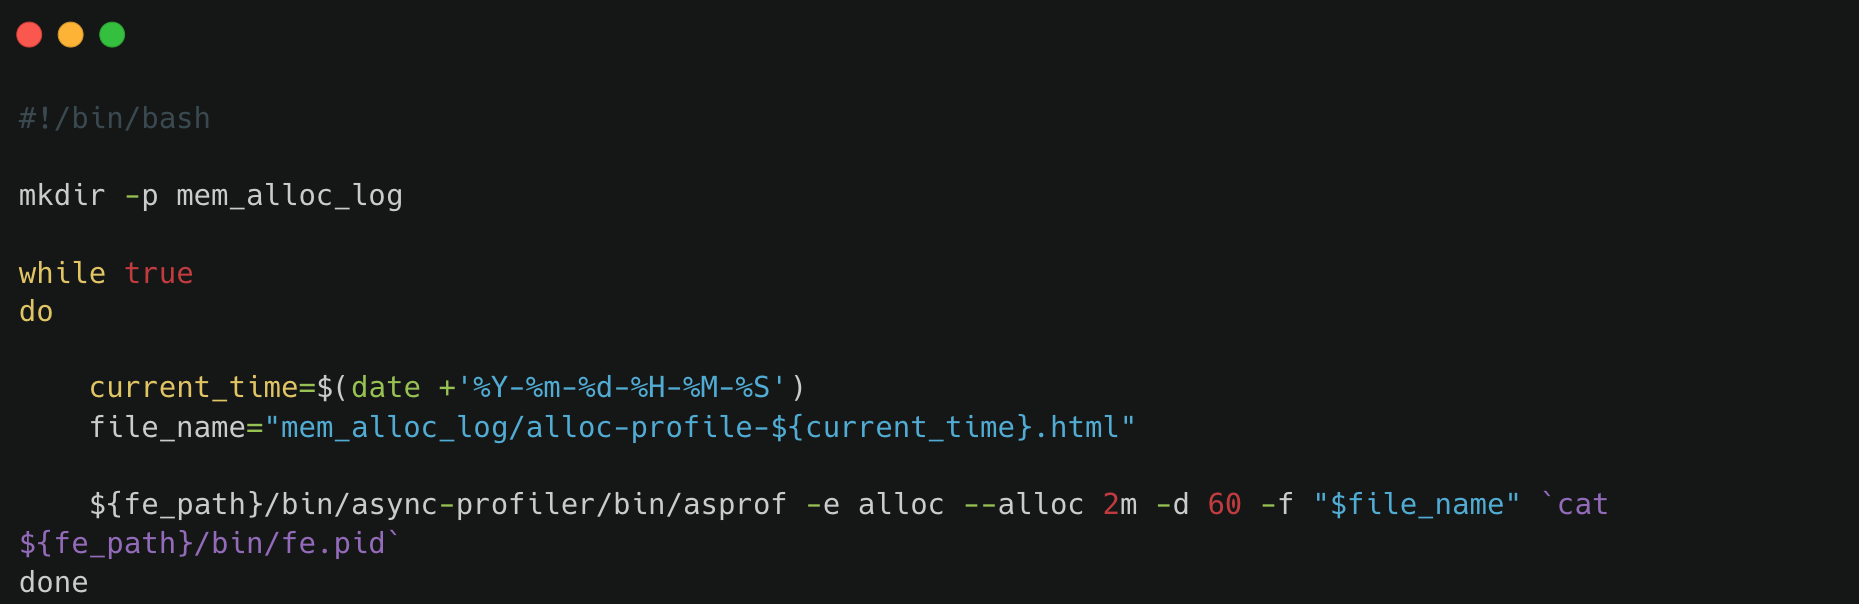
To investigate the source of JVM memory allocations, you can deploy the following script on the affected FE node. ${fe_path} refers to the FE installation directory.
This script periodically captures memory allocation profiles using async-profiler, which can help identify components responsible for excessive memory usage.
Starting from StarRocks 3.2, the FE provides a built-in memory profiling feature.
When enabled, the system automatically captures memory allocation profiles every five minutes.
By default, the generated profiles are stored in:
fe/log/proc_profile
You can verify the relevant configuration with:
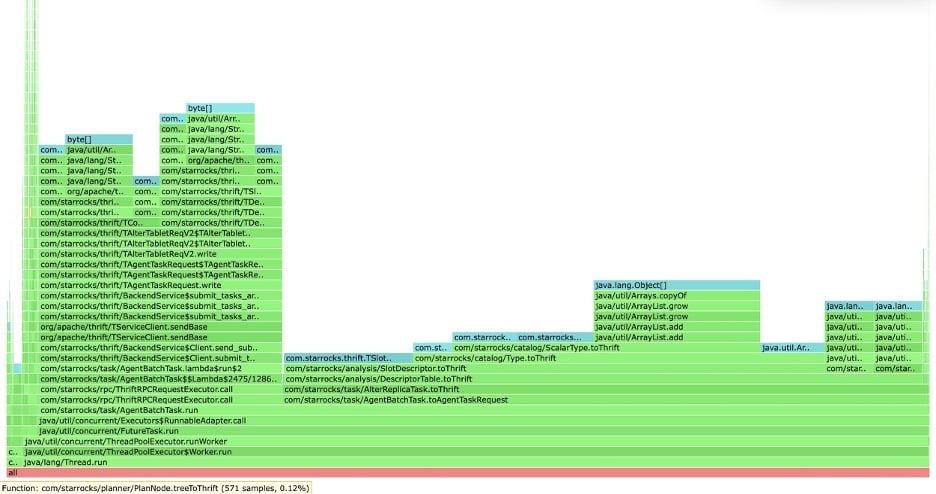
mysql> admin show frontend config like '%mem%';After opening a memory profile report, you can analyze memory usage patterns. For example, in some cases, the profile may reveal that memory consumption is caused by replica-related tasks such as ALTER REPLICA operations.
⚠️ Emergency Handling:
- If JVM memory usage remains consistently high and does not decrease, you can temporarily resolve the issue by restarting the affected FE node or increasing the JVM heap size (Xmx) and restarting the FE service.
- If memory usage spikes suddenly, it is often caused by complex or resource-intensive queries. In this case, review the audit logs around the time of the spike, identify the problematic SQL statement, and temporarily add it to the SQL blacklist to mitigate the issue.
3. Checkpoint Failure (🟡 Warning)
PromQL
starrocks_fe_meta_log_count{job="$job_name",instance="$fe_leader"} > 100000
🚨 Alert condition:
An alert is triggered when the number of BDB metadata logs on the FE node exceeds 100,000.
Under normal conditions, the system automatically performs a checkpoint once the BDB log count exceeds 50,000. After a successful checkpoint, the log count is reset to 0 and begins accumulating again.
🧰 Troubleshooting:
This alert typically indicates that the checkpoint process has not been executed successfully. You need to inspect the FE logs to determine the checkpoint status.
On the Leader FE node, search the fe.log file for entries similar to:
begin to generate new image: image.xxxx
If this entry appears, it means the system has started generating a metadata image. Continue checking the subsequent log messages from the same thread:
- If you see:
checkpoint finished save image.xxxx
the image was successfully generated and saved. - If you see:
Exception when generate new image file
the checkpoint process failed while generating the image.
In this case, investigate the specific error message in the logs and proceed carefully when handling metadata-related operations. It is recommended to consult the support team before making changes to the metadata.
4. Excessive FE Thread Count (🟡 Warning)
PromQL
starrocks_fe_thread_pool{job="$job_name"} > 3000
🚨 Alert condition:
An alert is triggered when the FE thread pool size exceeds 3,000.
🧰 Troubleshooting:
By default, both FE and BE nodes support up to 4,096 threads. In many cases, an unusually high thread count is caused by a large number of UNION ALL queries, which can significantly increase thread usage.
To mitigate this issue:
- Reduce the concurrency of UNION ALL queries where possible.
- Adjust the system variable pipeline_dop to limit parallel execution:
SET GLOBAL pipeline_dop = 8;
If adjusting individual SQL queries is not feasible, you can apply this change globally to control query parallelism.
⚠️ Emergency Handling:
In urgent situations, you can temporarily increase the FE thread capacity by adjusting the dynamic parameter thrift_server_max_worker_threads (default value: 4096) to restore service availability:
ADMIN SET FRONTEND CONFIG ("thrift_server_max_worker_threads" = "8192");
5. Compaction Issues
5.1 Compaction Failure Alert (🟡 Warning)
PromQL
increase(starrocks_be_engine_requests_total{job="$job_name",status="failed",type="cumulative_compaction"}[1m]) > 3increase(starrocks_be_engine_requests_total{job="$job_name",status="failed",type="base_compaction"}[1m]) > 3
🚨 Alert condition:
An alert is triggered if three or more Cumulative Compaction failures or three or more Base Compaction failures occur within one minute.
🧰 Troubleshooting:
Search the BE node logs for the following keywords to identify the tablet involved in the failure:
grep -E 'compaction' be.INFO | grep failed
If you see logs similar to the following, it indicates a compaction failure:
W0924 17:52:56:537041 123639 compaction_task_cpp:193] compaction task:8482. tablet:8423674 failed.
Review the surrounding log entries for the corresponding tablet to determine the root cause. In many cases, compaction failures occur when operations such as DROP TABLE or DROP PARTITION are executed during compaction.
StarRocks has an internal compaction retry mechanism. If necessary, you can also manually mark the problematic replica as BAD, which triggers a clone task to repair it.
⚠️ Before performing the following operation, ensure that the table has at least three healthy replicas.
ADMIN SET REPLICA STATUS PROPERTIES("tablet_id" = "$tablet_id","backend_id" = "$backend_id","status" = "bad");
5.2 High Compaction Pressure Alert (🟡 Warning)
PromQL
starrocks_fe_max_tablet_compaction_score{job="$job_name",instance="$fe_leader"} > 100
🚨 Alert condition:
An alert is triggered when the maximum compaction score exceeds 100, indicating significant compaction pressure in the cluster.
🧰 Troubleshooting:
This alert is typically caused by high-frequency ingestion operations, such as:
- Frequent data imports (e.g., once per second)
- INSERT INTO VALUES statements
- High-frequency DELETE operations
To mitigate the issue:
- Increase the interval between ingestion tasks (recommended ≥ 5 seconds).
- Avoid submitting high-concurrency DELETE operations.
5.3 Excessive Tablet Version Count Alert (🟡 Warning)
PromQL
starrocks_be_max_tablet_rowset_num{job="$job_name"} > 700
🚨 Alert condition:
An alert is triggered when the maximum number of versions (rowsets) for a tablet on a BE node exceeds 700.
🧰 Troubleshooting:
First, identify the tablets with excessive versions:
SELECT BE_ID, TABLET_IDFROM information_schema.be_tabletsWHERE NUM_ROWSET > 700;
For example, if the tablet ID is 2889156, inspect it using:
SHOW TABLET 2889156;
Then execute the command returned in the DetailCmd field:
SHOW PROC '/dbs/2601148/2889154/partitions/2889153/2889155/2889156';
Under normal circumstances:
- All three replicas should be in the NORMAL state.
- Other metrics such as RowCount and DataSize should be consistent across replicas.
If only one replica exceeds the version limit, you can mark that replica as BAD, which will trigger a clone task to rebuild it:
ADMIN SET REPLICA STATUS PROPERTIES("tablet_id" = "$tablet_id","backend_id" = "$backend_id","status" = "bad");
If more than two replicas exceed the version limit, you can temporarily increase the version limit.
Assuming be_ip is the BE node identified above (default BE HTTP port is 8040):
-- Default value of tablet_max_versions is 1000UPDATE information_schema.be_configsSET value = 2000WHERE name = "tablet_max_versions";
What’s Next
That covers the cluster service health pillar. Combined with the resource saturation alerts from Part 1, you now have solid coverage across the two foundational monitoring pillars for StarRocks.
Part 3 wraps up the series with the application availability pillar — covering query failures and P95 latency, connection and QPS overload, write failures, Routine Load consumption lag, import transaction limits, and materialized view and schema change failures. In short: everything that tells you whether your workloads are actually running, not just whether your nodes are up.
For full Prometheus & Grafana setup instructions, see StarRocks monitoring and alerting documentation.
💬 Join the StarRocks Community
Have questions or want to share how you’ve set up monitoring in your environment? Join the StarRocks community on Slack — it’s where the team and thousands of users discuss real-world deployments, troubleshooting, and best practices.