In day-to-day operations, unexpected issues pop up all the time. One moment everything is running smoothly, and the next you're scrambling to figure out why queries are timing out or nodes are suddenly under heavy load. Many teams end up stuck in a constant cycle of reacting to incidents and “putting out fires.”
.jpg?width=1360&height=768&name=image%20(7).jpg)
A solid monitoring and alerting system can help break that cycle. In this guide, we’ll walk through a practical monitoring approach based on three key areas: resource saturation, cluster service health, and application availability. Together, these perspectives help you see what’s happening across the entire system—from infrastructure resource pressure to cluster stability and user-facing performance.
The goal is simple: catch problems early and fix them before they turn into real incidents.
In Part 1 of the StarRocks Monitor & Alert Guide, we’ll start with resource saturation. By tracking metrics such as CPU usage, memory consumption, disk capacity, and I/O load, operators can quickly spot abnormal resource pressure and take action before it starts affecting query performance or cluster stability.
Key Monitoring Metrics
1. Host Resource Saturation
|
Metric |
Description |
|
starrocks_be_cpu |
CPU load |
|
starrocks_be_process_mem_bytes |
Memory used by BE (alerts should match actual BE memory capacity) |
|
node_memory_MemAvailable_bytes node_memory_MemTotal_bytes |
Machine memory usage |
|
node_disk_io_time_seconds_total |
Local disk load |
|
starrocks_be_disks_total_capacity |
Used local disk capacity |
|
node_filesystem_free_bytes{mountpoint="/"} |
Remaining space on root directory |
|
node_filesystem_free_bytes{mountpoint="${meta_path}"} /1024/1024/1024 |
Remaining FE metadata directory space |
2. Cluster Service Health
|
Metric |
Description |
|
up{group="fe", job="$job_name"}
|
Number of active FE nodes |
|
node_info{type="be_node_num", job="$job_name",state="dead"} |
Number of failed BE nodes |
|
jvm_heap_size_bytes |
JVM memory usage |
|
starrocks_be_engine_requests_total {status="failed",type="base_compaction"} |
Base compaction failures per second in BE |
|
starrocks_be_engine_requests_total {status="failed",type="cumulative_compaction"} |
Cumulative compaction failures per second in BE |
|
starrocks_fe_max_tablet_compaction_score |
The maximum compaction score among all BEs, indicating the current compaction pressure |
|
starrocks_be_max_tablet_rowset_num |
The maximum number of versions of a tablet in the BE |
|
starrocks_fe_meta_log_count |
The number of FE BDB metadata logs |
|
starrocks_fe_thread_pool |
FE thread pool size |
3. Application Availability
|
Metric |
Description |
|
starrocks_fe_query_err_rate |
Failed queries (including timeouts) |
|
starrocks_fe_query_internal_err |
Queries failed due to internal engine errors (Supported starting from versions 3.1.15, 3.2.11, and 3.3.3) |
|
starrocks_fe_query_total |
QPS |
|
starrocks_fe_query_latency_ms |
Query latency |
|
starrocks_fe_connection_total |
Total connections |
|
sum(starrocks_fe_connection_total) by(user) |
Connections per user |
|
starrocks_fe_routine_load_max_lag_of_partition |
Kafka ingestion lag (You need to enable the enable_routine_load_lag_metrics parameter in the FE configuration to monitor Routine Load lag; this parameter can be modified dynamically) |
|
starrocks_fe_routine_load_jobs |
Routine Load NEED_SCHEDULE job states |
|
Routine Load PAUSED job states |
|
|
starrocks_fe_txn_failed |
Failed import transactions |
|
starrocks_fe_mv_refresh_total_failed_jobs |
Failed materialized view refresh jobs |
|
starrocks_fe_txn_running |
Running import transactions (Available starting from versions 3.1.16, 3.2.12, and 3.3.5) |
|
starrocks_be_engine_requests_total |
Schema change failure rate |
Monitoring Alert Handling
Part 1: Detecting Resource Saturation
Here’s how to spot the warning signs and troubleshoot the issue.
1. High CPU Usage
PromQL:
(1-(sum(rate(starrocks_be_cpu{mode="idle"}[5m])) by (job, instance))/ (sum(rate(starrocks_be_cpu[5m])) by (job, instance))) * 100
🚨 Alert condition:
Trigger an alert when BE CPU utilization exceeds 90%.
🧰 Troubleshooting:
1. Check for large queries
show proc '/current_queries';
This command shows currently running queries and their resource consumption.
You can also inspect BE-side resource usage per query:
show proc '/current_queries/<query_id>/hosts';
2. Analyze audit logs
You can also analyze it through audit logs. For plugin installation, refer to: https://docs.starrocks.io/docs/administration/management/audit_loader/
SELECT timestamp, queryTime, stmt, memcostbytes, stateFROM starrocks_audit_db__.starrocks_audit_tbl__WHERE timestamp > "2025-03-01 00:00:00"ORDER BY memcostbytes DESCLIMIT 10;
3. Investigate using system tools
Locate the BE process:
[yaochenggong@cs02 ~]$ ps aux|grep starrocks_beyaochenggong+ 4921 0.2 0.1 3121372 80488 ? Sl Nov03 20:05 /home/disk1/yaochenggong/StarRocks-2.5.13/be/lib/starrocks_be
*Note: Find the PID of the BE process. In this example, it is 4921.
Check threads:
top -Hp <be_pid>
Use perf for CPU profiling:
sudo perf top -p $be_pid -g >/tmp/perf.txt
*Note: Run for 1–2 minutes, then press CTRL+C to stop.
4. Stack trace analysis
Try obtaining the stack trace by running the following command on the FE. $backend_id refers to the BE node experiencing the issue
admin execute on $backend_id 'System.print(ExecEnv.get_stack_trace_for_all_threads())'
You can also use pstack tools. Recommended 3rd party tool: https://github.com/brendangregg/FlameGraph
⚠️ Emergency Handling:
If service needs to be restored quickly, you can try restarting the affected BE service. Before restarting, make sure to capture and preserve the pstack output for later analysis.
This approach is typically used when a BE node shows persistently abnormal resource usage—for example, CPU utilization remains fully saturated and cannot be reduced through normal troubleshooting.
2. BE Memory Usage Overload
PromQL:
starrocks_be_process_mem_bytes > machine_memory * 90%
🚨 Alert condition:
BE memory usage exceeds 90%.
🧰 Troubleshooting:
Method 1:
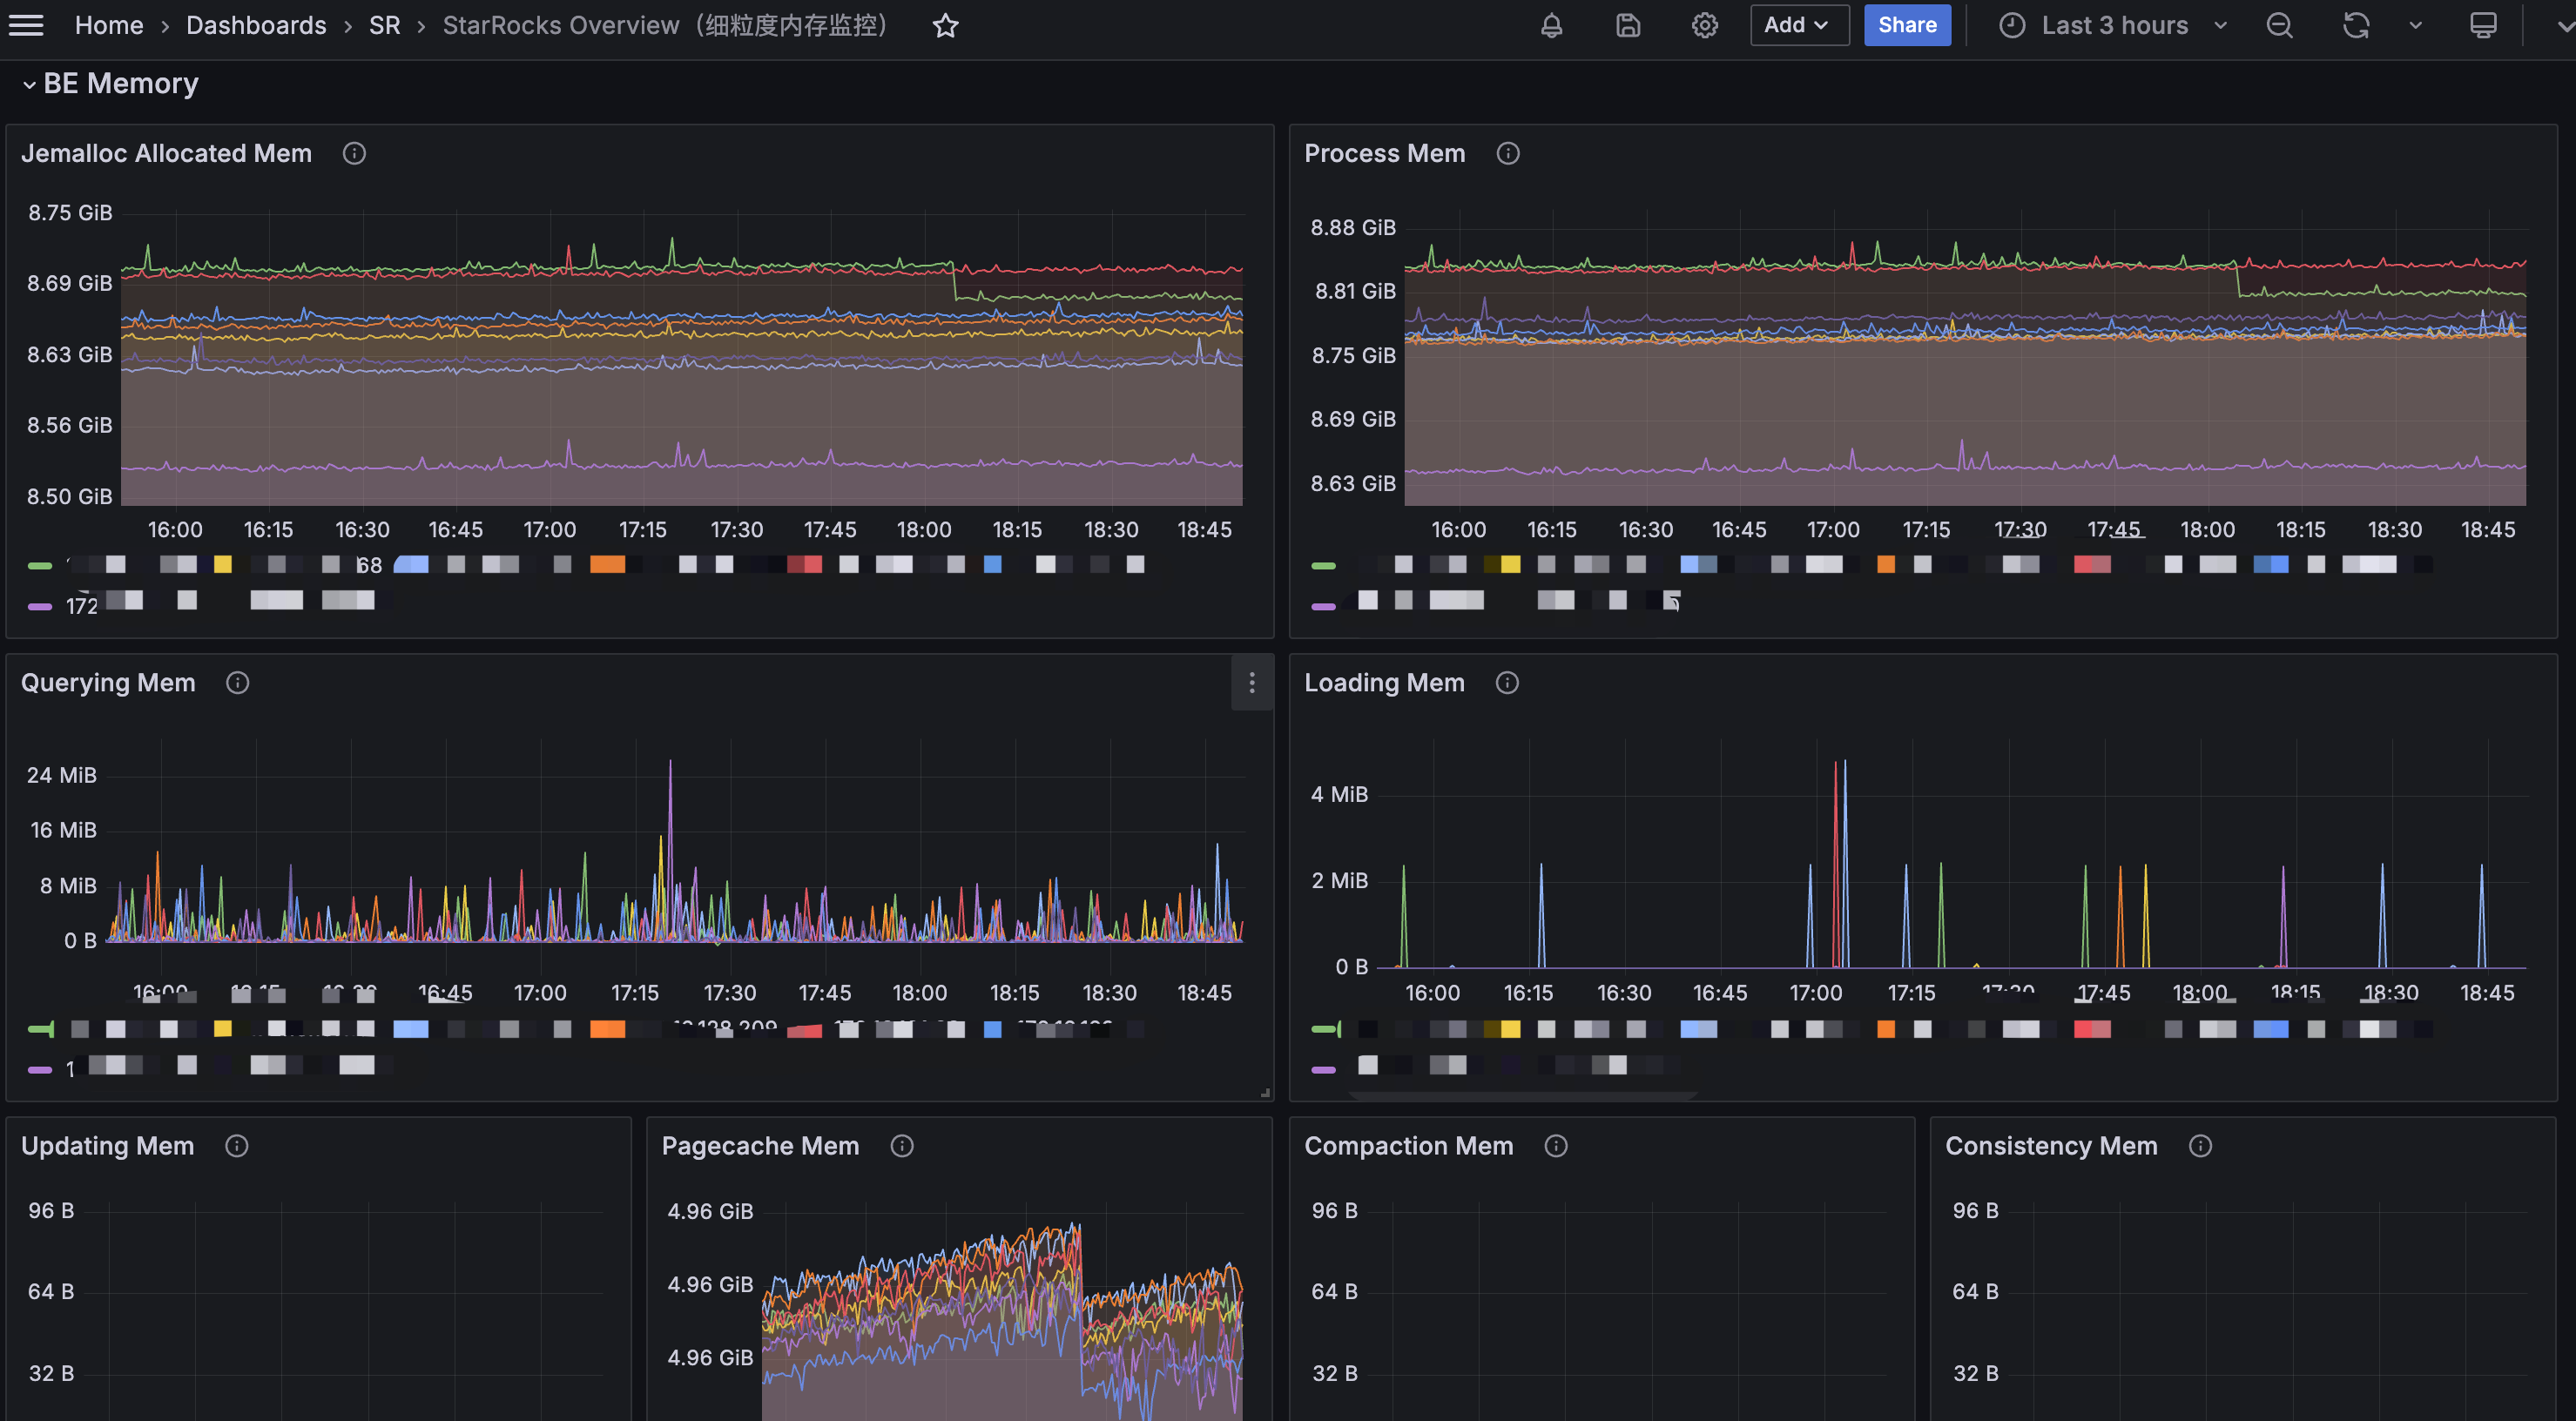
You can view the BE Memory panel in Grafana to determine which component’s memory usage is increasing.
Alternatively, you can use the curl command to output the detailed memory usage distribution:
curl -XGET -s http://BE_IP:BE_HTTP_PORT/metrics | grep "^starrocks_be_.*_mem_bytes"
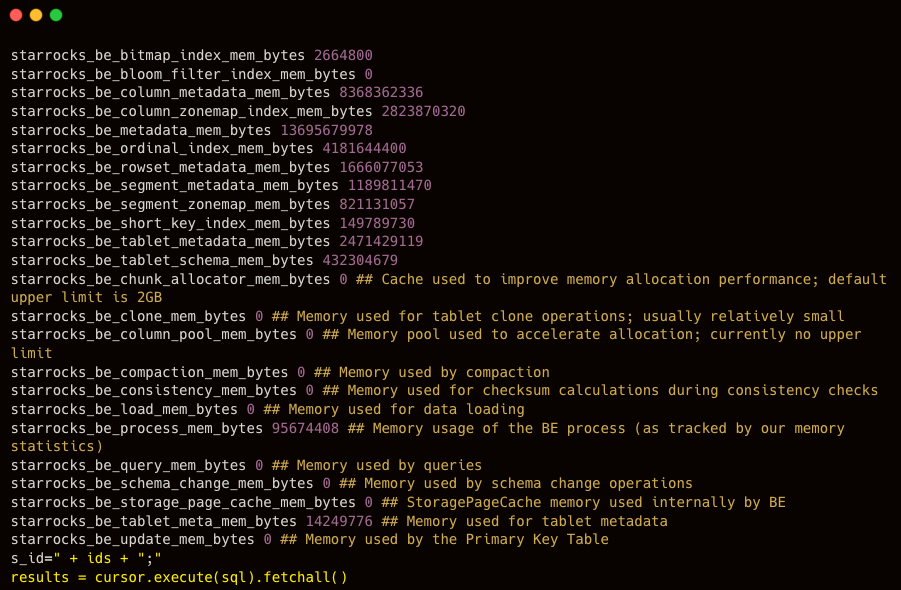
After reviewing the memory usage, you can examine the corresponding metrics to identify any abnormal or unreasonable components and make adjustments based on those specific indicators.
Method 2:
The mem_tracker information can also be viewed through the web interface:
http://be_ip:8040/mem_tracker
The interface is displayed as follows:
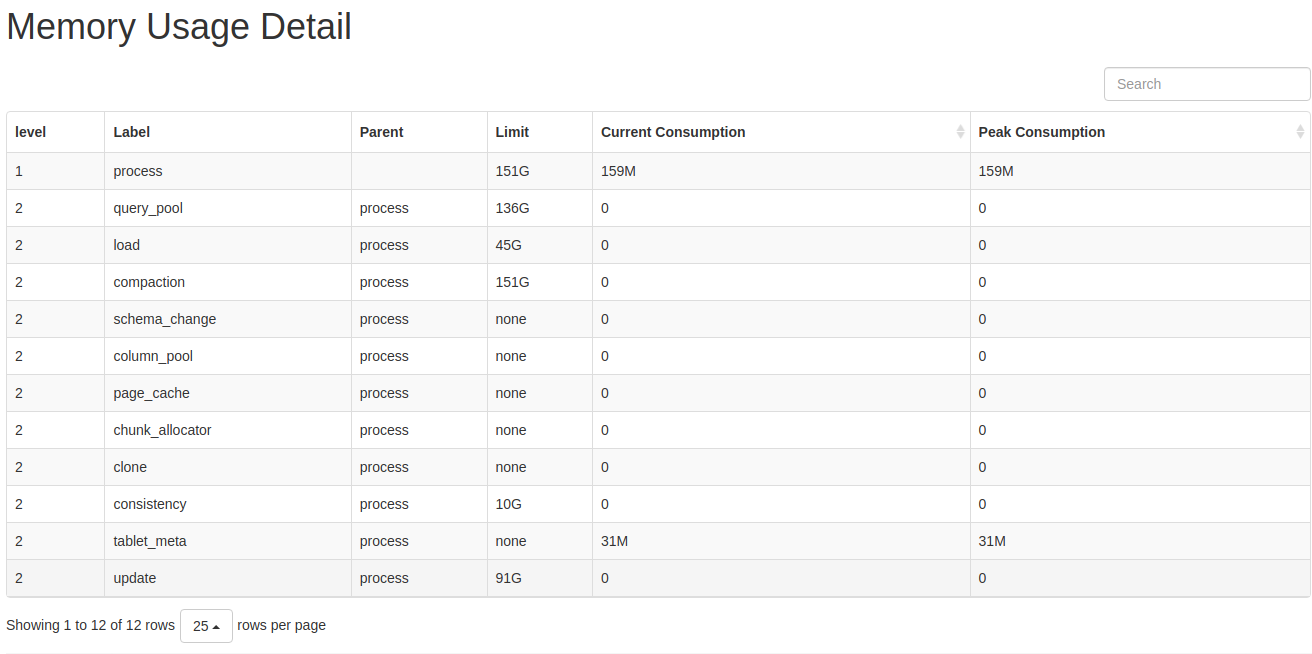
Metric Descriptions:
- level: MemTracker uses a tree structure. The first level represents the total memory used by the BE, and the second level represents memory usage by category.
- Label: Identifies the memory category. Refer to the memory classification for the meaning of each metric.
- Parent: The label of the parent node.
- Limit: Memory usage limit. A value of -1 indicates no limit.
- Current Consumption: Current memory usage.
- Peak Consumption: Peak memory usage.
Using this method, you can generally identify which component is consuming excessive memory, and then make appropriate adjustments or take emergency actions such as restarting the service.
⚠️ Emergency Handling
If service needs to be restored quickly, you can restart the affected BE service.
This is typically used when a BE node’s memory usage remains fully saturated for an extended period, and the cause cannot be identified or mitigated through normal troubleshooting.
3. High Machine Memory Usage
PromQL
(1 - node_memory_MemAvailable_bytes{instance=~".*"} / node_memory_MemTotal_bytes{instance=~".*"}) * 100 > 90
🚨 Alert condition:
An alert is triggered when the machine memory usage exceeds 90%.
🧰 Troubleshooting:
- If no other services are deployed on the same machine, refer to Sections 2 and 3 to investigate the memory usage of FE or BE.
-
If other services are co-located on the machine, use the top command to identify the specific processes consuming memory.
⚠️ Emergency Handling:
If service needs to be restored quickly, you can try restarting the affected BE service.
This approach is typically used when a BE node’s memory usage remains abnormally high for an extended period and cannot be reduced through normal troubleshooting.
If the issue is caused by other services impacting StarRocks, you may also consider temporarily stopping those services to relieve system pressure.
4. High Disk Load
PromQL
rate(node_disk_io_time_seconds_total{instance=~".*"}[5m]) * 100 > 90
🚨 Alert condition:
An alert is triggered when the disk utilization on a machine exceeds 90%.
🧰 Troubleshooting:
node_disk_io_time_seconds_total represents the disk I/O utilization metric for each BE node. The higher the value, the busier the disk I/O. In most cases, disk I/O resources are primarily consumed by query workloads.
If an alert related to node_disk_io_time_seconds_total occurs, first check whether there have been changes in the business workload.
- If there were recent changes, determine whether they can be rolled back to restore the previous resource balance.
- If there were no changes, consider whether normal business growth has increased the workload and whether resource scaling is required.
4.1 Check for Other Applications on the Machine
Determine whether other applications are running on the same machine and consuming disk I/O resources abnormally.
Use the following tool to check whether other processes are using disk I/O: iotop
4.2 Check for Large Queries
In general, applying partition pruning in queries on large tables can effectively reduce the amount of data scanned.
You should check whether the SQL query conditions and the table schema are designed appropriately. Avoid situations where missing partitions lead to unnecessary disk I/O consumption.
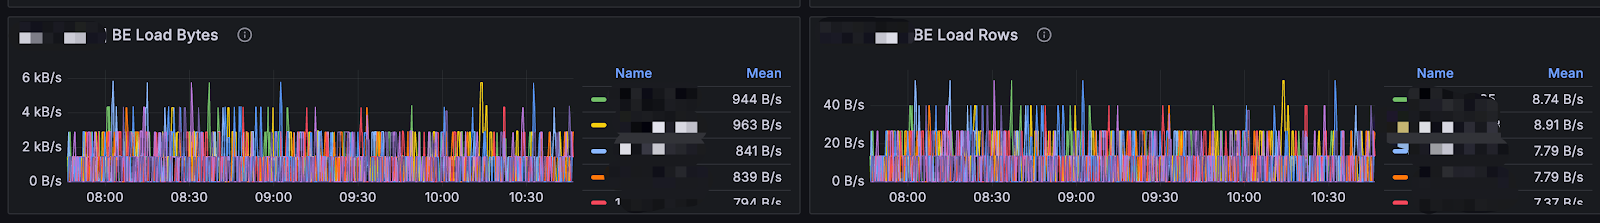
4.3 Check for Large Data Imports
In the BE panel of Grafana, you can check whether there are significant changes in the number of imported bytes or rows.
.png?width=2950&height=452&name=image%20(50).png)
4.4 Check for Materialized View Creation or Schema Change Operations
Creating materialized views and performing schema change operations are asynchronous tasks, and their resource consumption depends on the actual data volume.
You can check the progress of materialized view creation using the following command:
SHOW ALTER MATERIALIZED VIEW FROM db_name;
You can check the progress of schema change tasks using the following command:
SHOW ALTER TABLE COLUMN;
It is recommended to perform materialized view creation and schema change operations on large tables during off-peak business hours.
4.5 If the Cause of Increased I/O Load Cannot Be Determined
If the cause of the increased I/O load still cannot be identified, log in to the machine with high I/O usage for further investigation.
-
Check Which Processes Are Using Disk I/O with iotop
You can use the iotop tool to analyze and monitor disk I/O usage. iotop provides a UI similar to top, displaying information such as PID, user, I/O usage, and process name.
Install iotop:
yum -y install iotop
Run the command iotop and you’ll see:
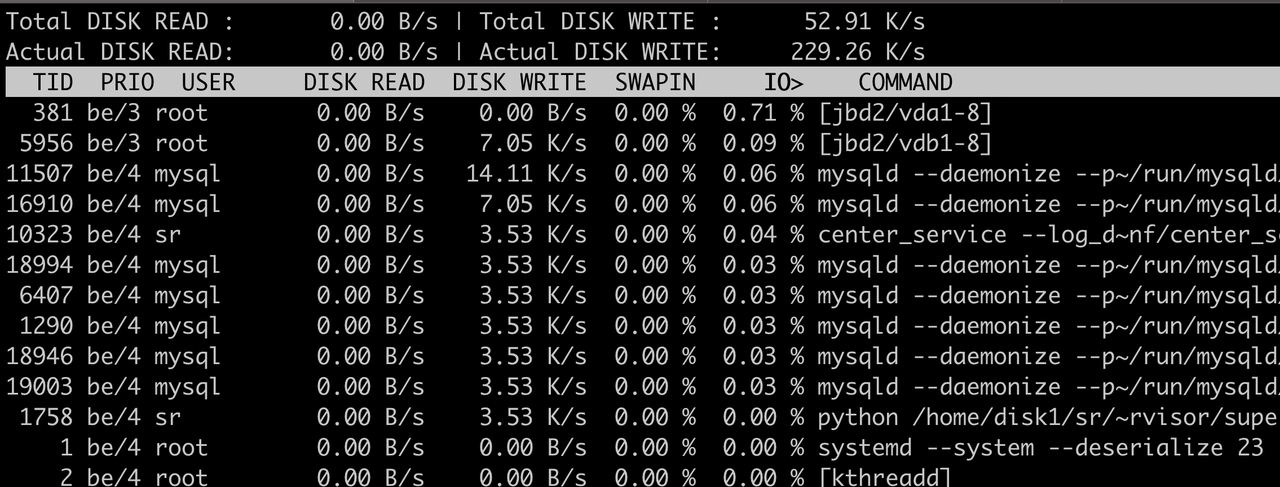
Output Explanation
- Total DISK READ – Total read rate from disk
- Total DISK WRITE – Total write rate to disk
- Actual DISK READ – Actual read rate from disk
- Actual DISK WRITE – Actual write rate to disk
- TID – Thread ID (press p to convert it to Process ID)
- PRIO – Priority
- USER – Owner of the thread
- DISK READ – Disk read rate of the thread
- DISK WRITE – Disk write rate of the thread
- SWAPIN – Percentage of time spent swapping
- IO> – Percentage of time spent waiting for I/O
- COMMAND – The command executed by the process
- For detailed explanations of the metrics and usage, refer to --help.
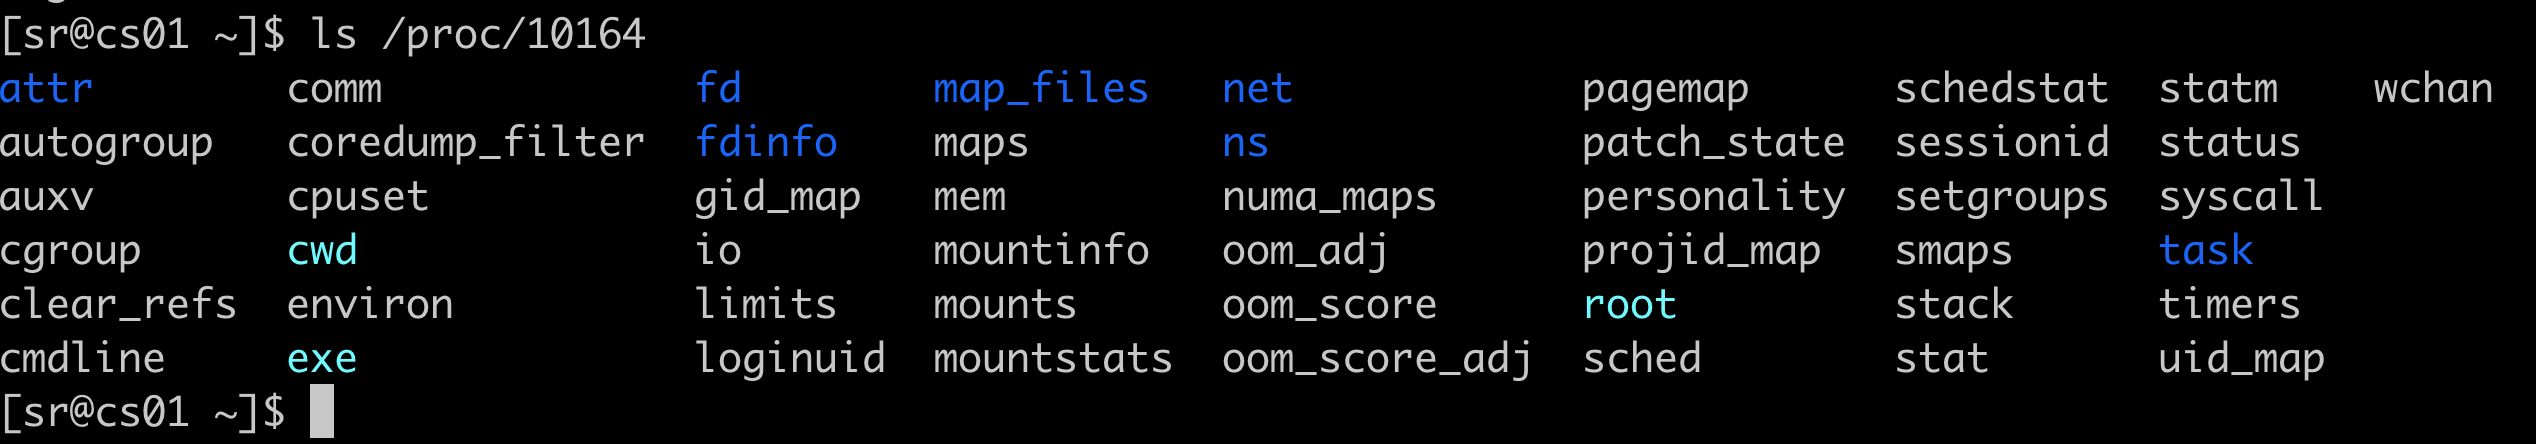
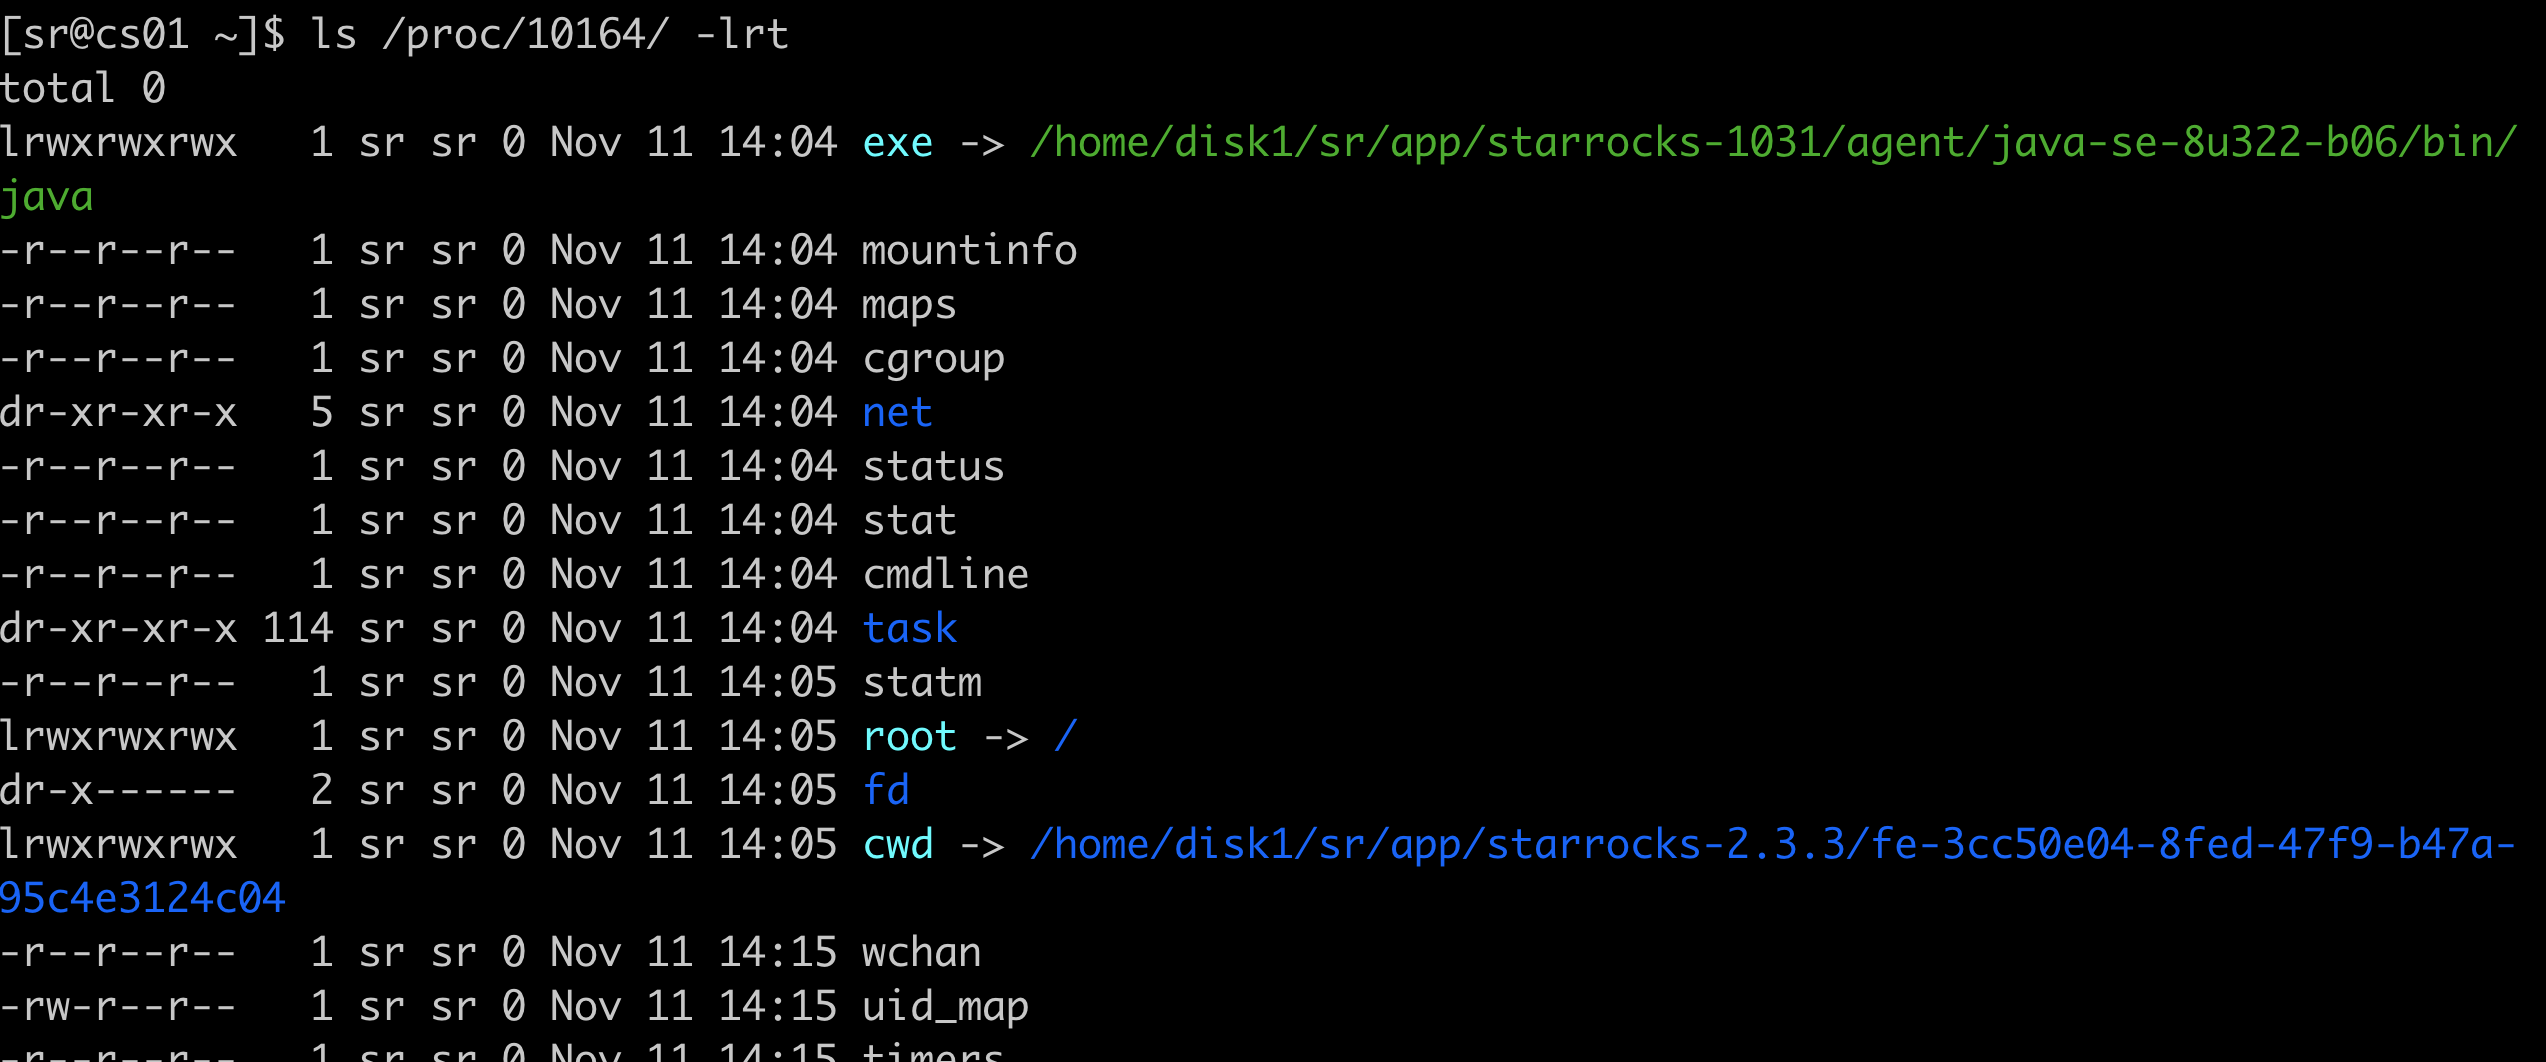
You can also check parent-child processes and environment variables of a running process:

ls /proc/$pid
-
Determine Whether the Load Is Read or Write Using iostat
You can use the iostat tool to analyze detailed disk usage statistics. iostat is part of the sysstat package and can be installed via yum.
yum install sysstat -y
Basic Syntax
iostat <options> <device name>
Common Options
- -c – Display CPU usage statistics
- -d – Display disk usage statistics
- --dec={0|1|2} – Specify decimal places (default: 2)
- -g GROUP_NAME { DEVICE [...] | ALL } – Display statistics for a group of devices
- -H – This option must be used together with -g. It indicates that only the group-level global statistics should be displayed, rather than statistics for individual devices within the group.
- -h – Print sizes in a human-readable format
- -j { ID | LABEL | PATH | UUID | ... } [ DEVICE [...] | ALL ] – Display persistent device names. Options such as ID, LABEL, etc., specify the type of persistent name to display.
- -k – Display values in KB
- -m – Display values in MB
- -N – Display LVM information
- -n – Display NFS usage
- -p – Display disk and partition statistics
- -t – Display timestamps. The timestamp format may depend on the S_TIME_FORMAT environment variable
- -V – Display version information and exit
- -x – Display detailed information (including data from some extended columns)
- -y – if multiple records are displayed within a given time interval, ignore the first set of statistics since system startup
- -z – Omit the output for any devices that had no activity during the sampling period
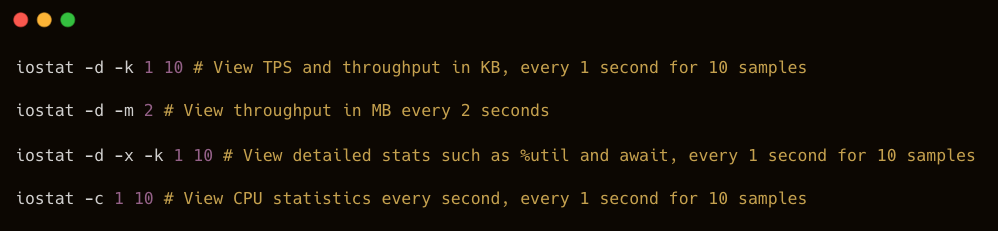
Common Usage Examples:
Understanding iostat Output:
Example output:
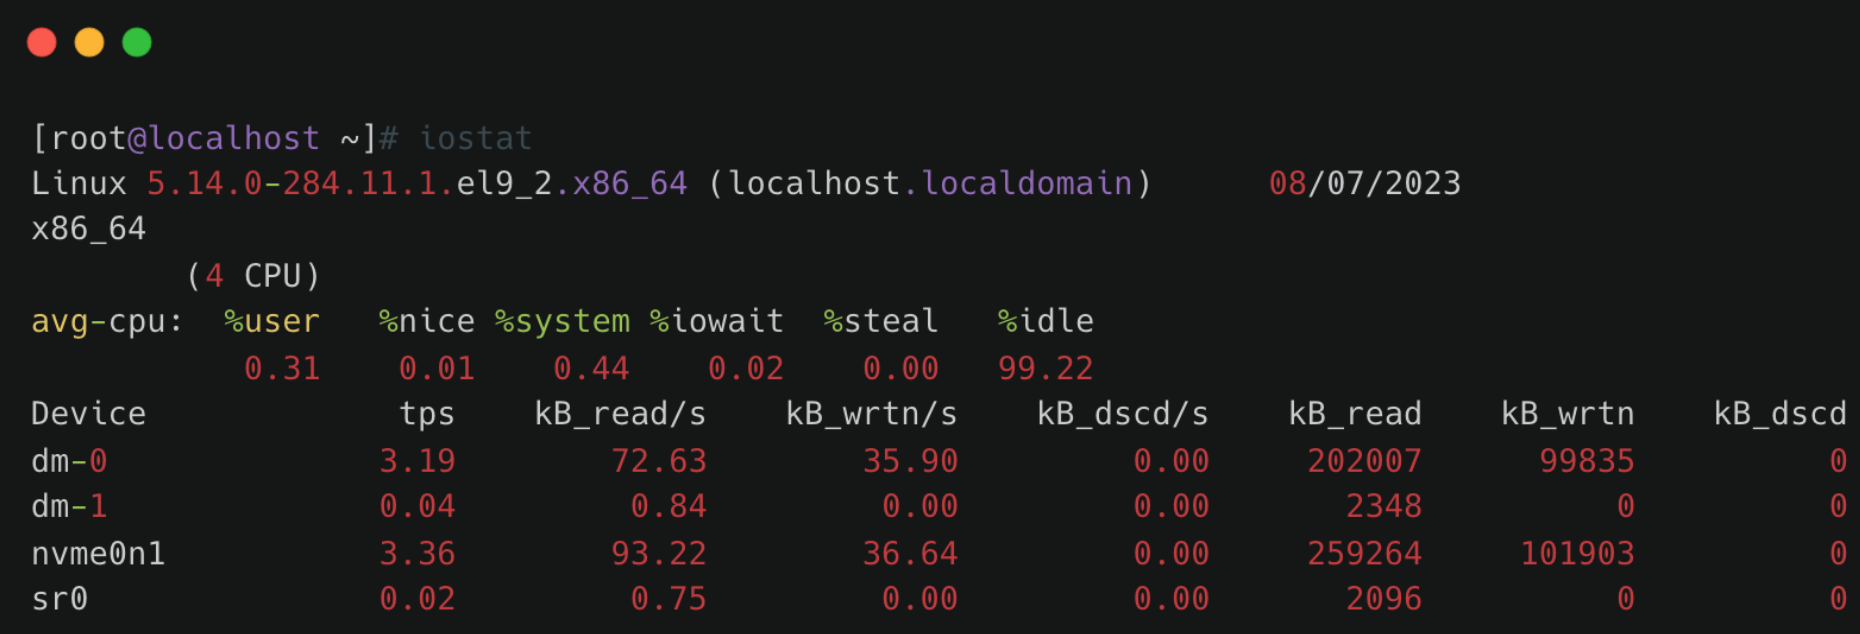
- Linux version – Kernel version
- localhost.localdomain – Hostname
- Date – Current system date
- x86_64 – CPU architecture
- (4 CPU) – Number of CPUs
CPU Statistics
avg-cpu: %user %nice %system %iowait %steal %idle0.31 0.01 0.44 0.02 0.00 99.22
Explanation:
- %user – Percentage of time the CPU spends in user mode.
- %nice – Percentage of time the CPU spends in user mode with a NICE value.
- %system – Percentage of time the CPU spends in system (kernel) mode.
- %iowait – Percentage of time the CPU spends waiting for I/O operations to complete.
- %steal – Percentage of involuntary wait time for the virtual CPU while the hypervisor services another virtual processor.
- %idle – Percentage of time the CPU is idle.
Disk Statistics Section
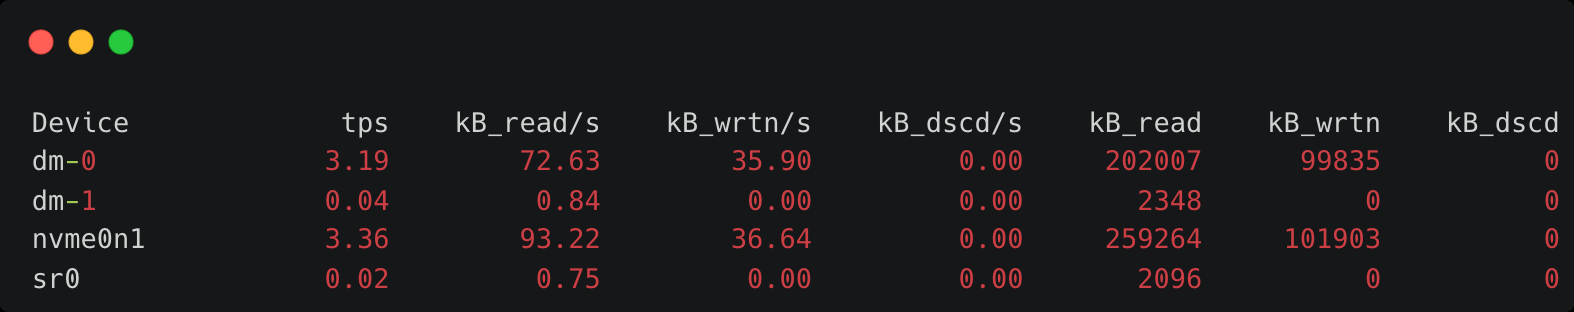
Field meanings:
- Device – Disk or partition name under /dev
- tps – Number of transfers per second for the device. A transfer corresponds to one I/O request. Multiple logical requests may be merged into a single I/O request. The size of each transfer request is unknown.
- kB_read/s – Data read per second (KB/s)
- kB_wrtn/s – Data written per second (KB/s)
- kB_dscd/s – Discarded blocks per second (KB/s)
- kB_read – Total data read (KB)
- kB_wrtn – Total data written (KB)
- kB_dscd – Total discarded blocks
In practice, the most commonly used command is:
iostat -kx 1
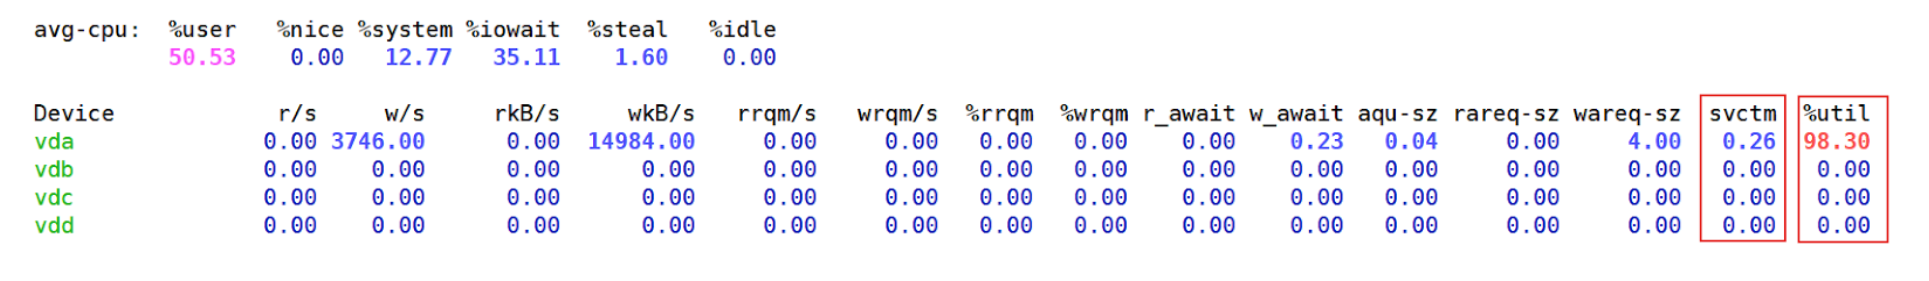
From the output:
- wkB indicates the disk write throughput.
- %util indicates the current disk utilization.
- Identify Which Files Are Causing High Disk I/O
After identifying a busy disk, determine which files are being read or written.
For example:
- If the disk device is vdb
- df -h shows it is mounted at /data1
Then filter using the mount path:
lsof -p $be_pid|grep '/data1'|grep 'w'
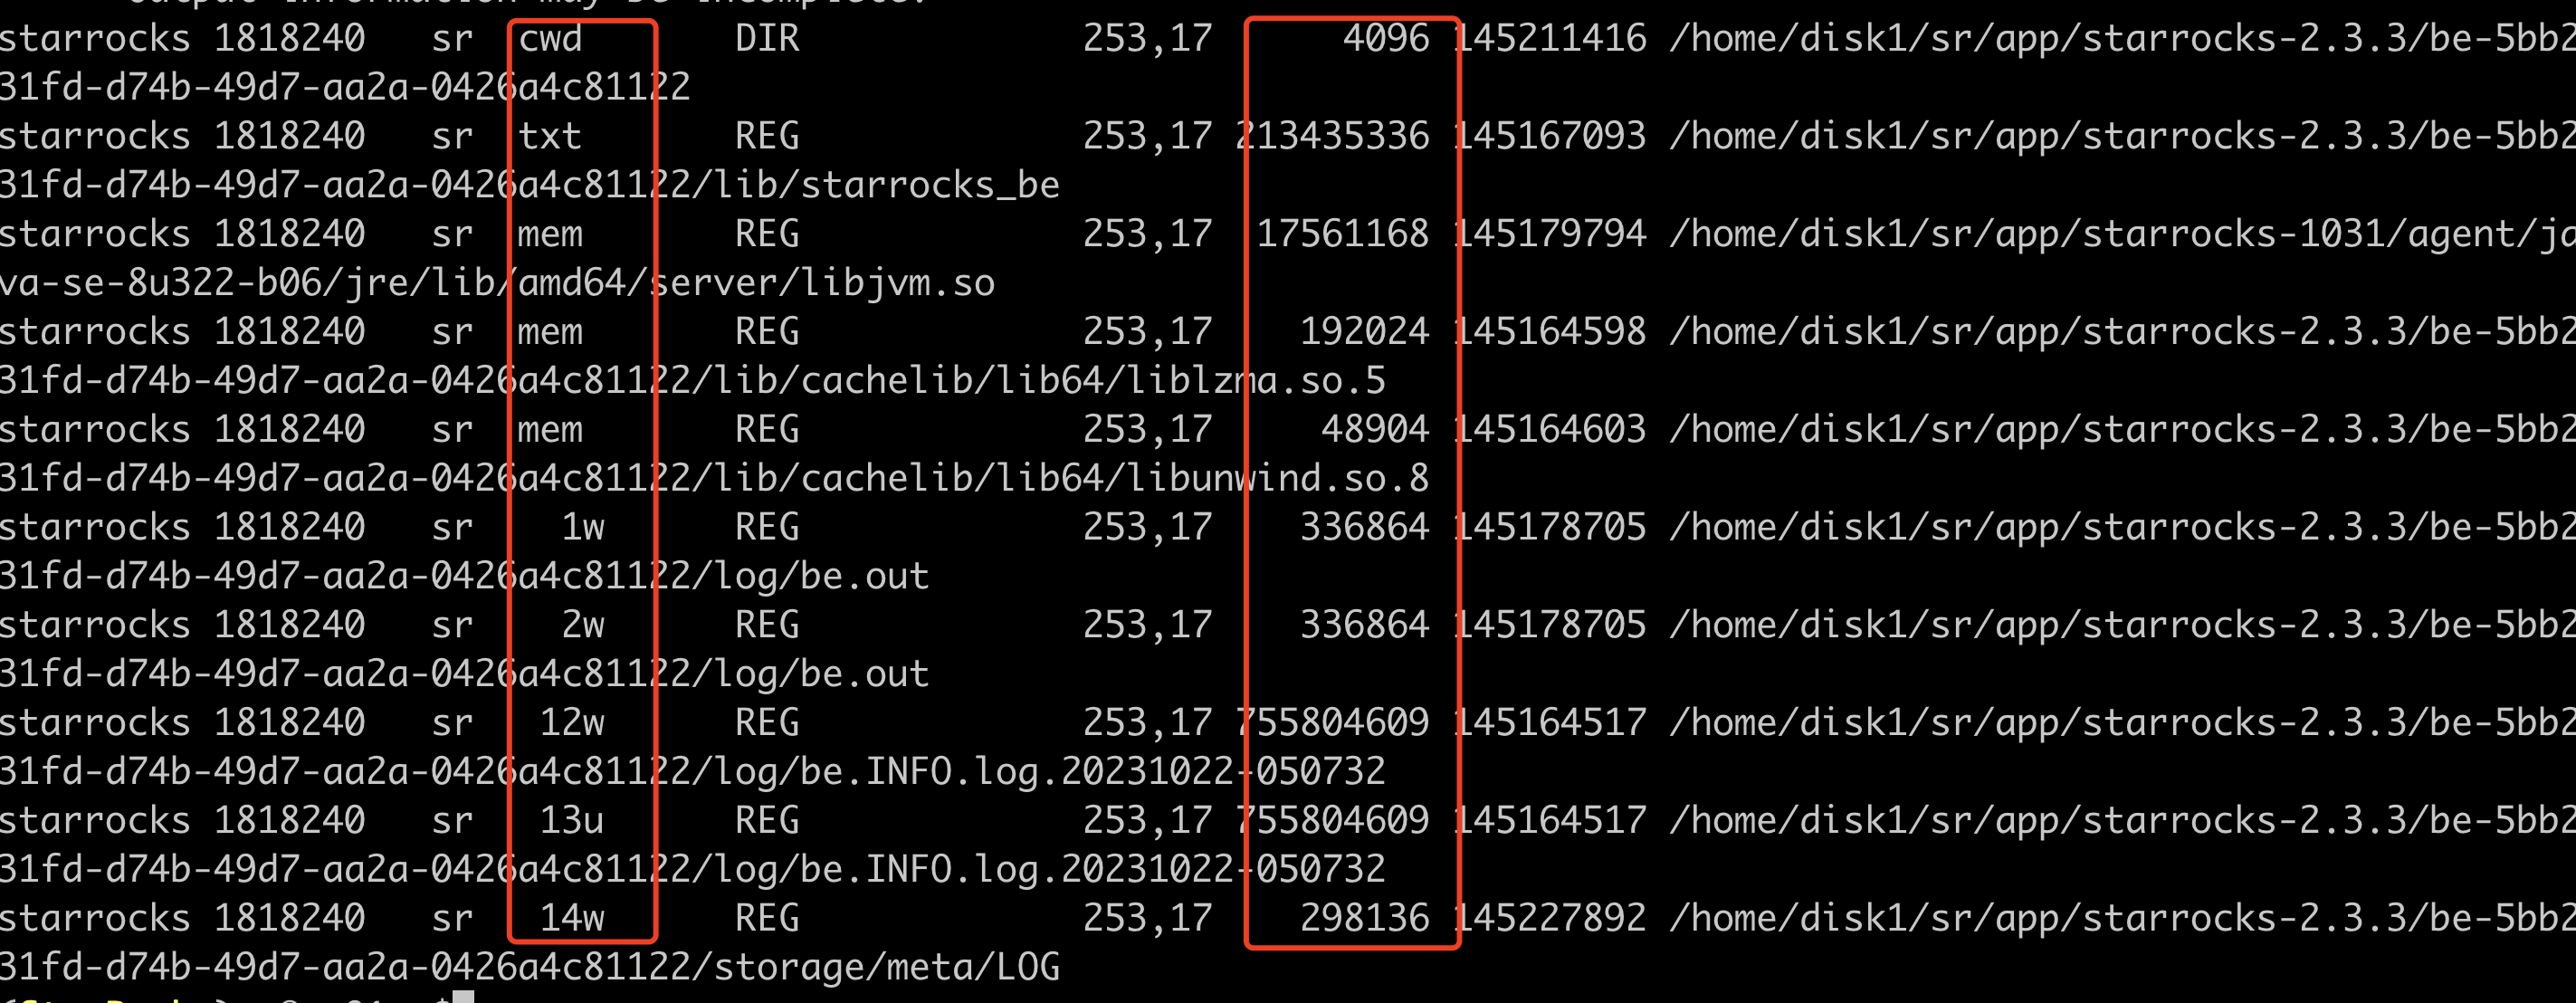
Key columns:
- Column 4 (FD) – File descriptor
- u – File opened for read/write
- r – File opened for read
- w – File opened for write
- Column 7 – File size (bytes): By running this command multiple times, you can determine whether certain files are being frequently written, helping identify the source of high disk I/O.
⚠️ Emergency Handling:
- If necessary, reduce unnecessary business traffic immediately, and restart BE nodes with high I/O usage to release disk pressure.
- If disk resources are consistently saturated under normal workloads, consider expanding disk capacity or adding more nodes (recommended).
5. BE Disk Usage
PromQL
(SUM(starrocks_be_disks_total_capacity{job="$job"}) by (host, path)- SUM(starrocks_be_disks_avail_capacity{job="$job"}) by (host, path))
/ SUM(starrocks_be_disks_total_capacity{job="$job"}) by (host, path) * 100 > 90
🚨 Alert condition:
An alert is triggered when disk usage exceeds 90%.
🧰 Troubleshooting:
5.1 Check Whether Data Ingestion Has Increased
Check whether the volume of imported data has changed.
You can monitor the load_bytes metric in the Grafana dashboard. If a large increase in data ingestion is observed, consider scaling up cluster resources.
5.2 Check for DROP Operations
If the ingestion volume has not changed significantly, but the data used value shown in SHOW BACKENDS does not match the actual disk usage, verify whether any DROP operations were recently performed, such as:
- DROP DATABASE
- DROP TABLE
- DROP PARTITION
You can check this through the audit log:
SELECT timestamp, queryTime, stmt, stateFROM starrocks_audit_db__.starrocks_audit_tbl__WHERE stmt LIKE 'drop%';
When a DROP operation occurs, the related metadata is retained in FE memory for 1 day to allow recovery from accidental deletion using RECOVER. During this period, the actual disk usage may appear larger than the dataused value shown in SHOW BACKENDS.
The retention time in FE memory can be adjusted using the parameter:
ADMIN SET FRONTEND CONFIG ("catalog_trash_expire_second"="86400");
If persistence is required, add this configuration to fe.conf.
After one day, the dropped data moves from FE memory to the BE trash directory:
${storage_root_path}/trash
By default, files remain in the trash directory for 3 days. During this time, disk usage may still appear larger than the data used value in SHOW BACKENDS.
The BE configuration controls the trash retention period:
trash_file_expire_time_sec
- Default: 259200 seconds (3 days)
- Since v2.5.17, v3.0.9, and v3.1.6, the default has changed to 86400 seconds (1 day).
You can modify it using:
UPDATE information_schema.be_configsSET value = xxxWHERE name = "trash_file_expire_time_sec";
If persistence is required, add the configuration to be.conf.
💡Recommendations
1. Use TRUNCATE Instead of DROP for Data Cleanup
When cleaning data, it is recommended to use TRUNCATE, since DROP operations move data into the trash directory.
If you are certain the data is no longer needed and want to release disk space immediately, you can use:
DROP TABLE FORCE
This command releases disk space immediately by bypassing checks for unfinished transactions.
However, it should be used with caution, because tables deleted with DROP TABLE FORCE cannot be recovered.
2. Identify Large Disk Consumers
You can use the following commands to locate directories consuming large amounts of disk space:
df -h
df -ih
du -sh
These commands help identify non-data files that may occupy large amounts of disk space, such as:
- FE logs
- BE logs
- Files in the trash directory
6. Insufficient Root Directory Space
PromQL
node_filesystem_free_bytes{mountpoint="/"} /1024/1024/1024 < 5
🚨 Alert condition:
An alert is triggered when the remaining disk space in the root directory falls below 5 GB.
🧰 Troubleshooting:
You can use the following command to identify which directories consume the most disk space and clean up unnecessary files in time. Common directories that may occupy large amounts of space include /var, /opt, and /tmp.
du -h / --max-depth=1
7. Insufficient Space in the FE Metadata Mount Point
PromQL
node_filesystem_free_bytes{mountpoint="${meta_path}"} /1024/1024/1024 < 10
🚨 Alert condition:
An alert is triggered when the available disk space for FE metadata falls below 10 GB.
🧰 Troubleshooting:
Use the following command to analyze which directories consume the most disk space and remove unnecessary files. The metadata path is specified by the meta_dir parameter in fe.conf.
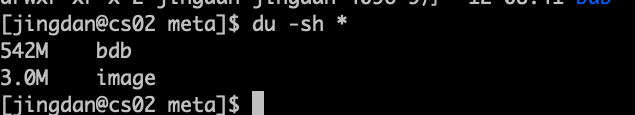
du -h /${meta_dir} --max-depth=1
If the meta directory occupies excessive space, it is usually due to a large BDB directory, which may indicate a checkpoint failure.
🤔 Want to learn more about StarRocks best practices? Join the StarRocks Slack community to ask questions, share ideas, and connect with other users. 💡