✍🏼 About The Author:Kaisen Kang, StarRocks TSC Member, Query Engine Team Lead at CelerData
With nearly a decade of experience designing and implementing OLAP engines such as Apache Kylin, Apache Doris, and StarRocks, I’ve worked across systems that operate at massive scale and handle demanding production workloads with strict performance requirements. I now lead the Query Team at CelerData, where we built key components of StarRocks from the ground up, including the vectorized query engine, cost-based optimizer, and pipeline execution engine.
In this blog, I’d like to share lessons learned from that journey and offer practical guidance for anyone aspiring to become an expert in database performance optimization: why it matters, what to focus on when tuning query performance, and how to develop the skills needed to grow into an expert.
Here are 10 things you need to know to optimize OLAP query performance:
1. Why Query Performance Optimization Matters
For a database product, effective query performance optimization can deliver a significant impact:
-
Achieve 10× performance gains, reducing hardware requirements from 100 nodes to 10.
-
Cut query latency from 10 seconds to 1 second, enabling truly interactive analytics and unlocking use cases that were previously impractical.
-
Drive higher product adoption, since performance tuning is almost always a core part of any product POC, and query performance is one of the easiest metrics for users to evaluate.
For a database engineer, it matters because:
-
Achieving multi-fold or even order-of-magnitude improvements is highly rewarding and provides a strong sense of accomplishment.
-
It rapidly accelerates professional growth, because database performance optimization is a deeply multidimensional and complex engineering discipline that spans architecture and implementation, hardware and software, and everything from kernel behavior to application design.
2. Goals of Query Performance Optimization
From an application perspective, the core goals are lower latency and higher throughput. (When total resources stay the same, reducing response time usually increases throughput as well.)
From a system perspective, the goal is to improve how efficiently we use CPU, I/O, memory, and network resources. (As we optimize performance, we need to watch resource usage closely, because sometimes a big speedup comes at the cost of consuming much more CPU.)
3. Identifying Performance Bottlenecks
There are two primary ways to identify performance bottlenecks:
-
By using the database’s built-in performance tuning and observability tools
-
By using general-purpose Linux performance analysis tools to diagnose system-level issues
Below, I’ll use StarRocks as the database example.
3.1 StarRocks Observability: Query Profile
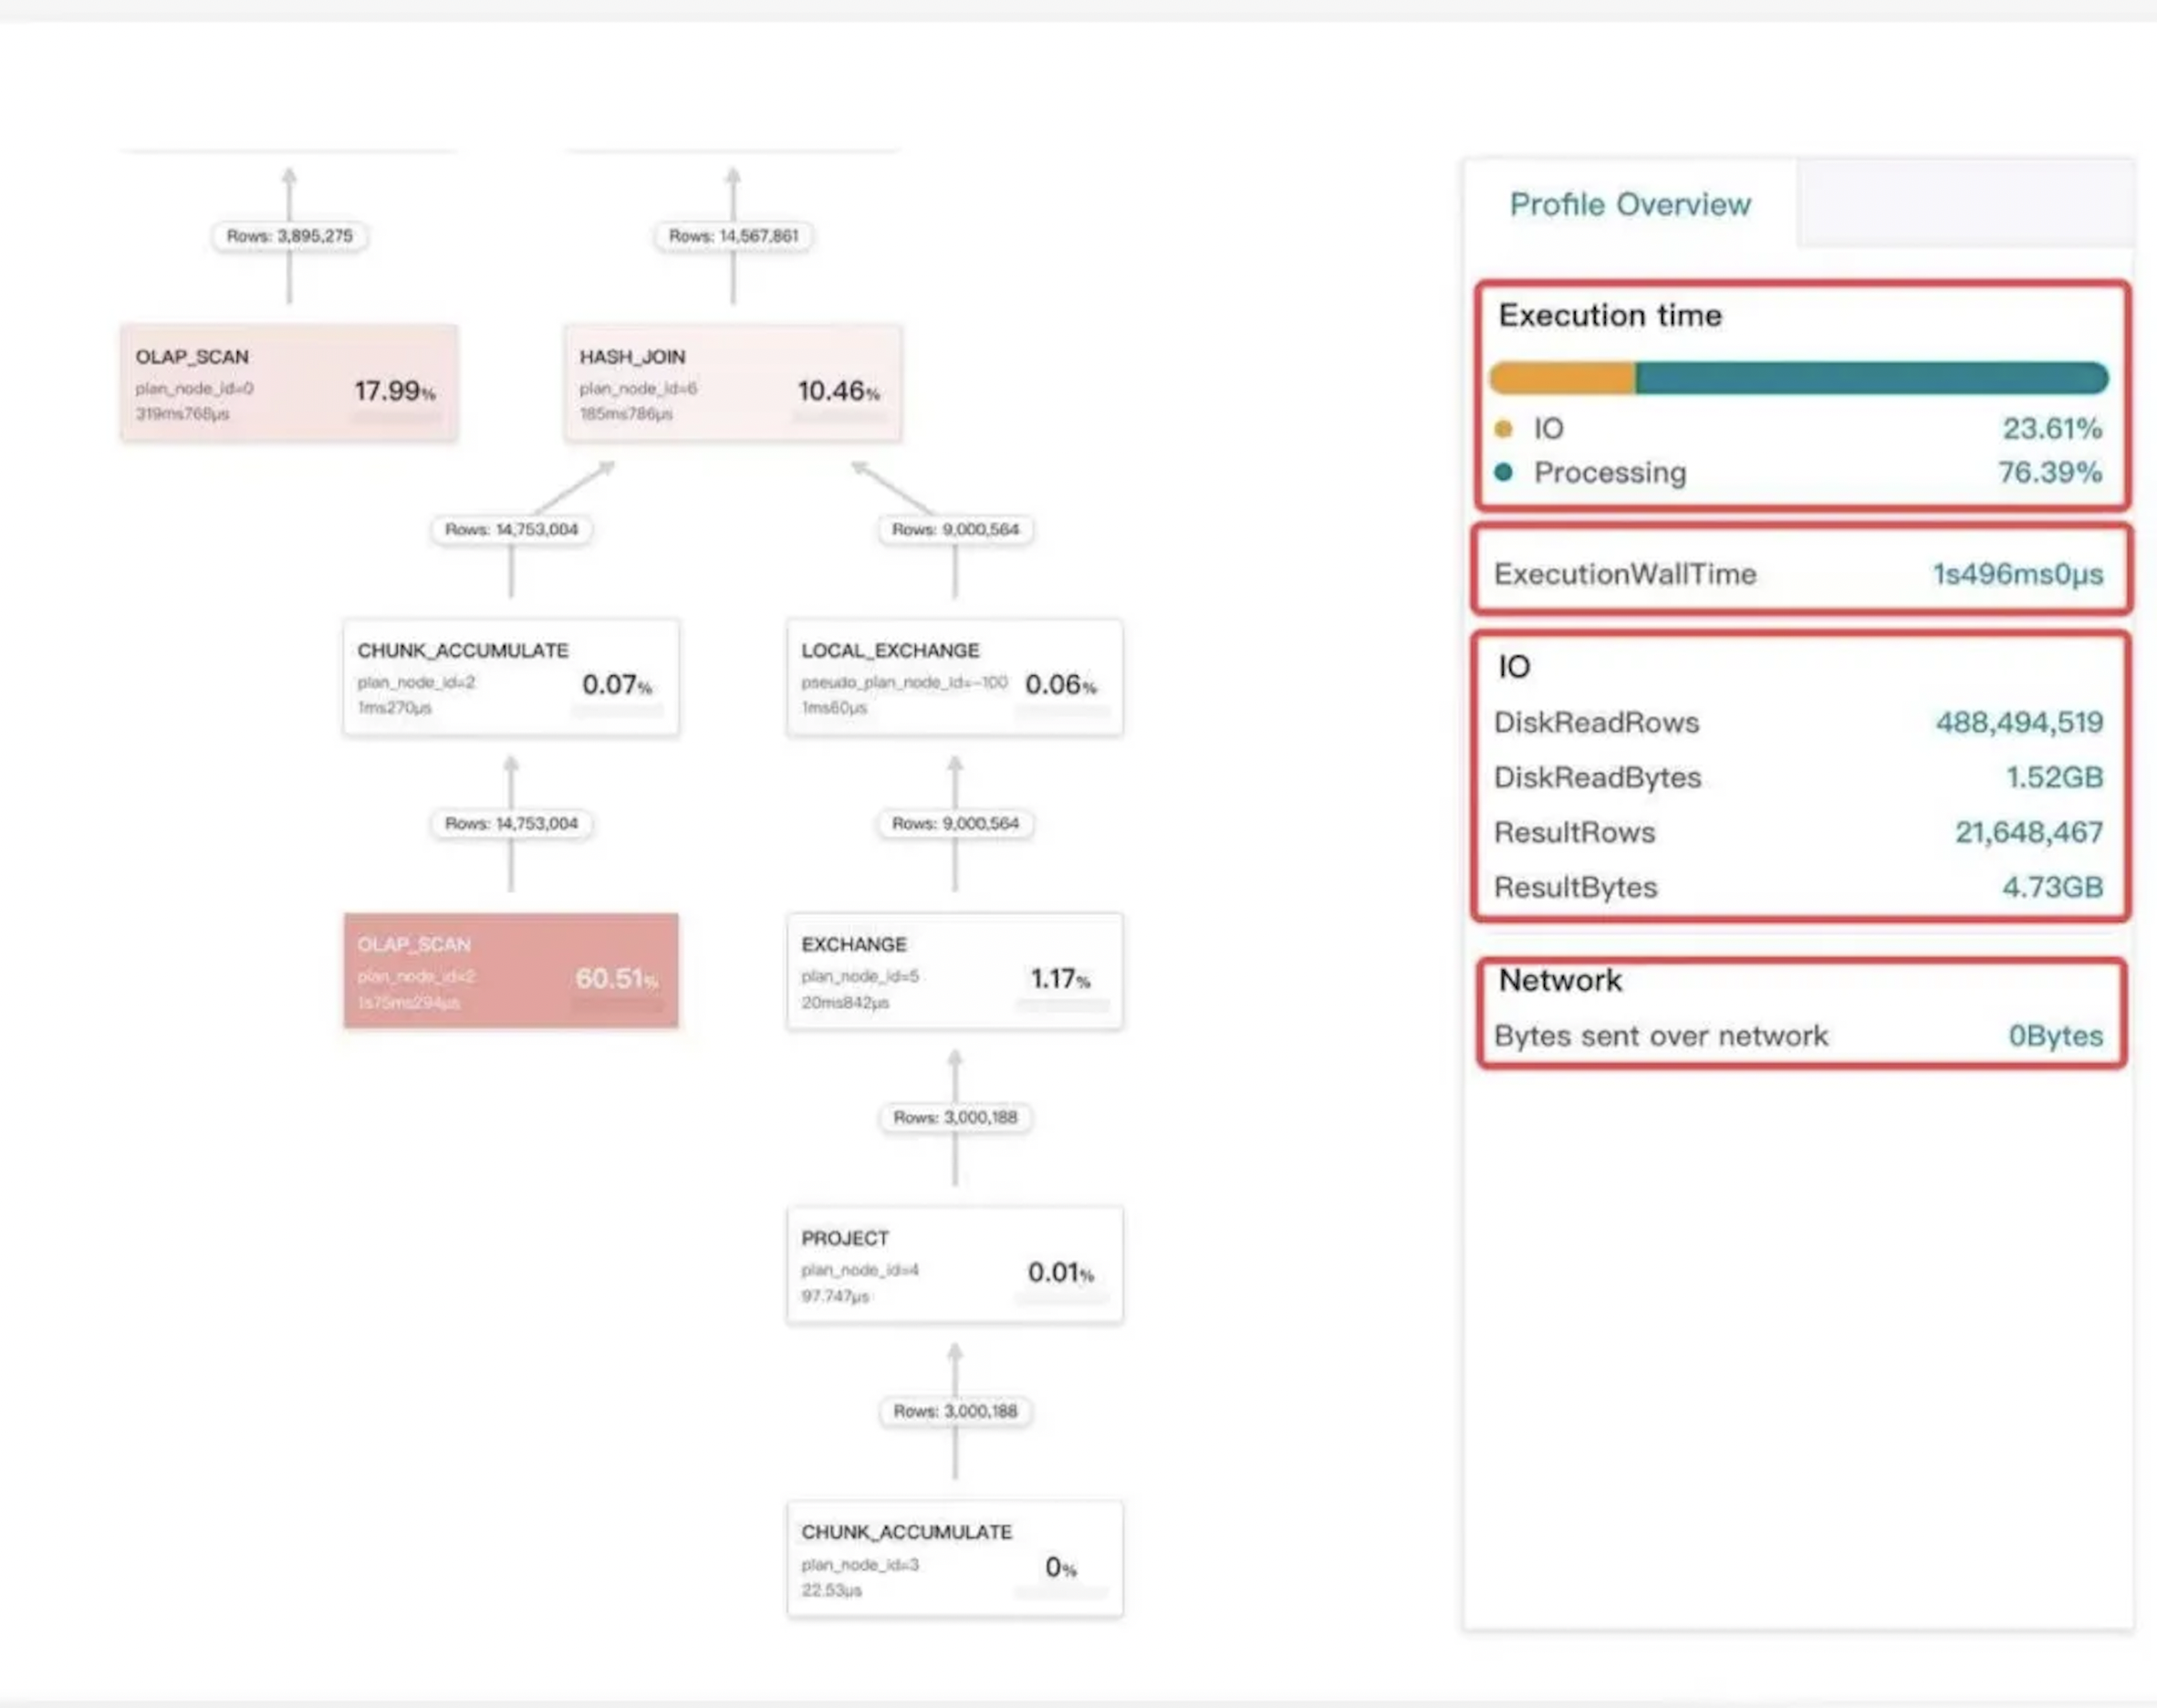
As shown in the diagram above, the query profile is our most commonly used tool for identifying performance bottlenecks. From the profile, we can determine whether a query is slow during the planning phase or the execution phase, and we can pinpoint which operator is causing the execution bottleneck.
3.2 StarRocks Observability: Optimizer Trace
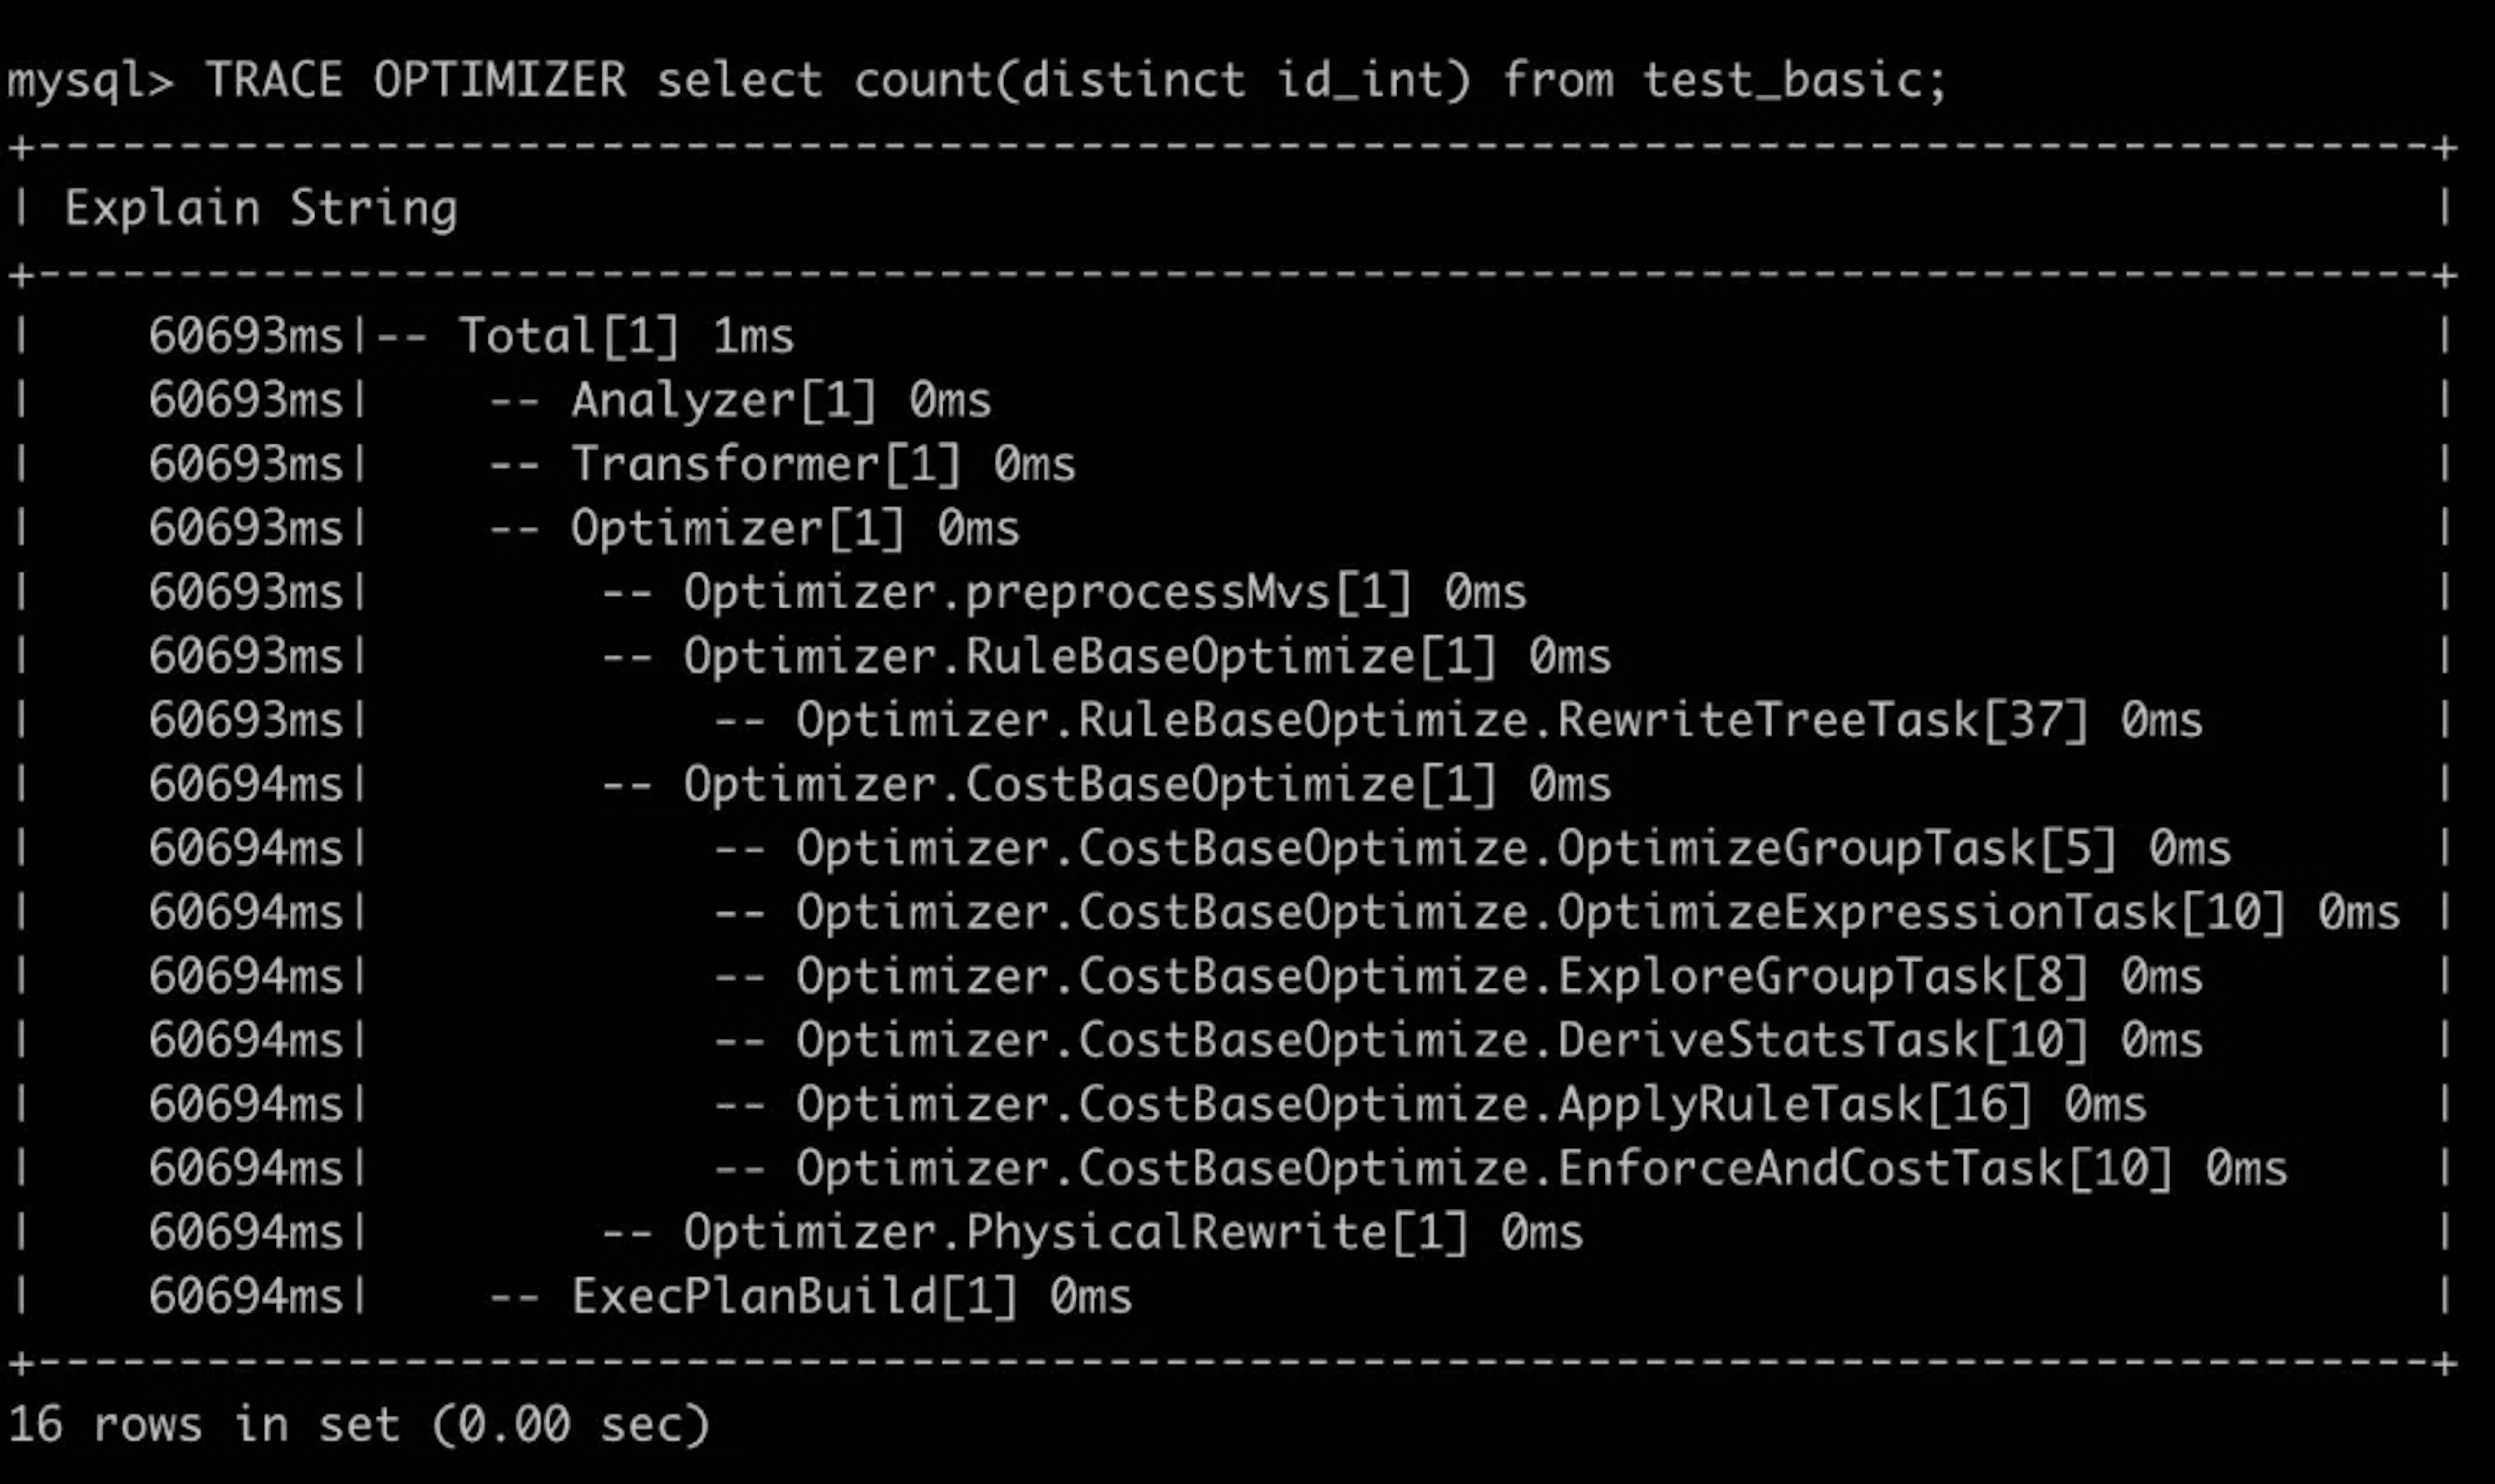
With a single command, the optimizer trace reveals which stage of the StarRocks optimizer is taking the most time. This makes it easy to pinpoint bottlenecks during the optimization process itself.
3.3 StarRocks Observability: Executor Trace
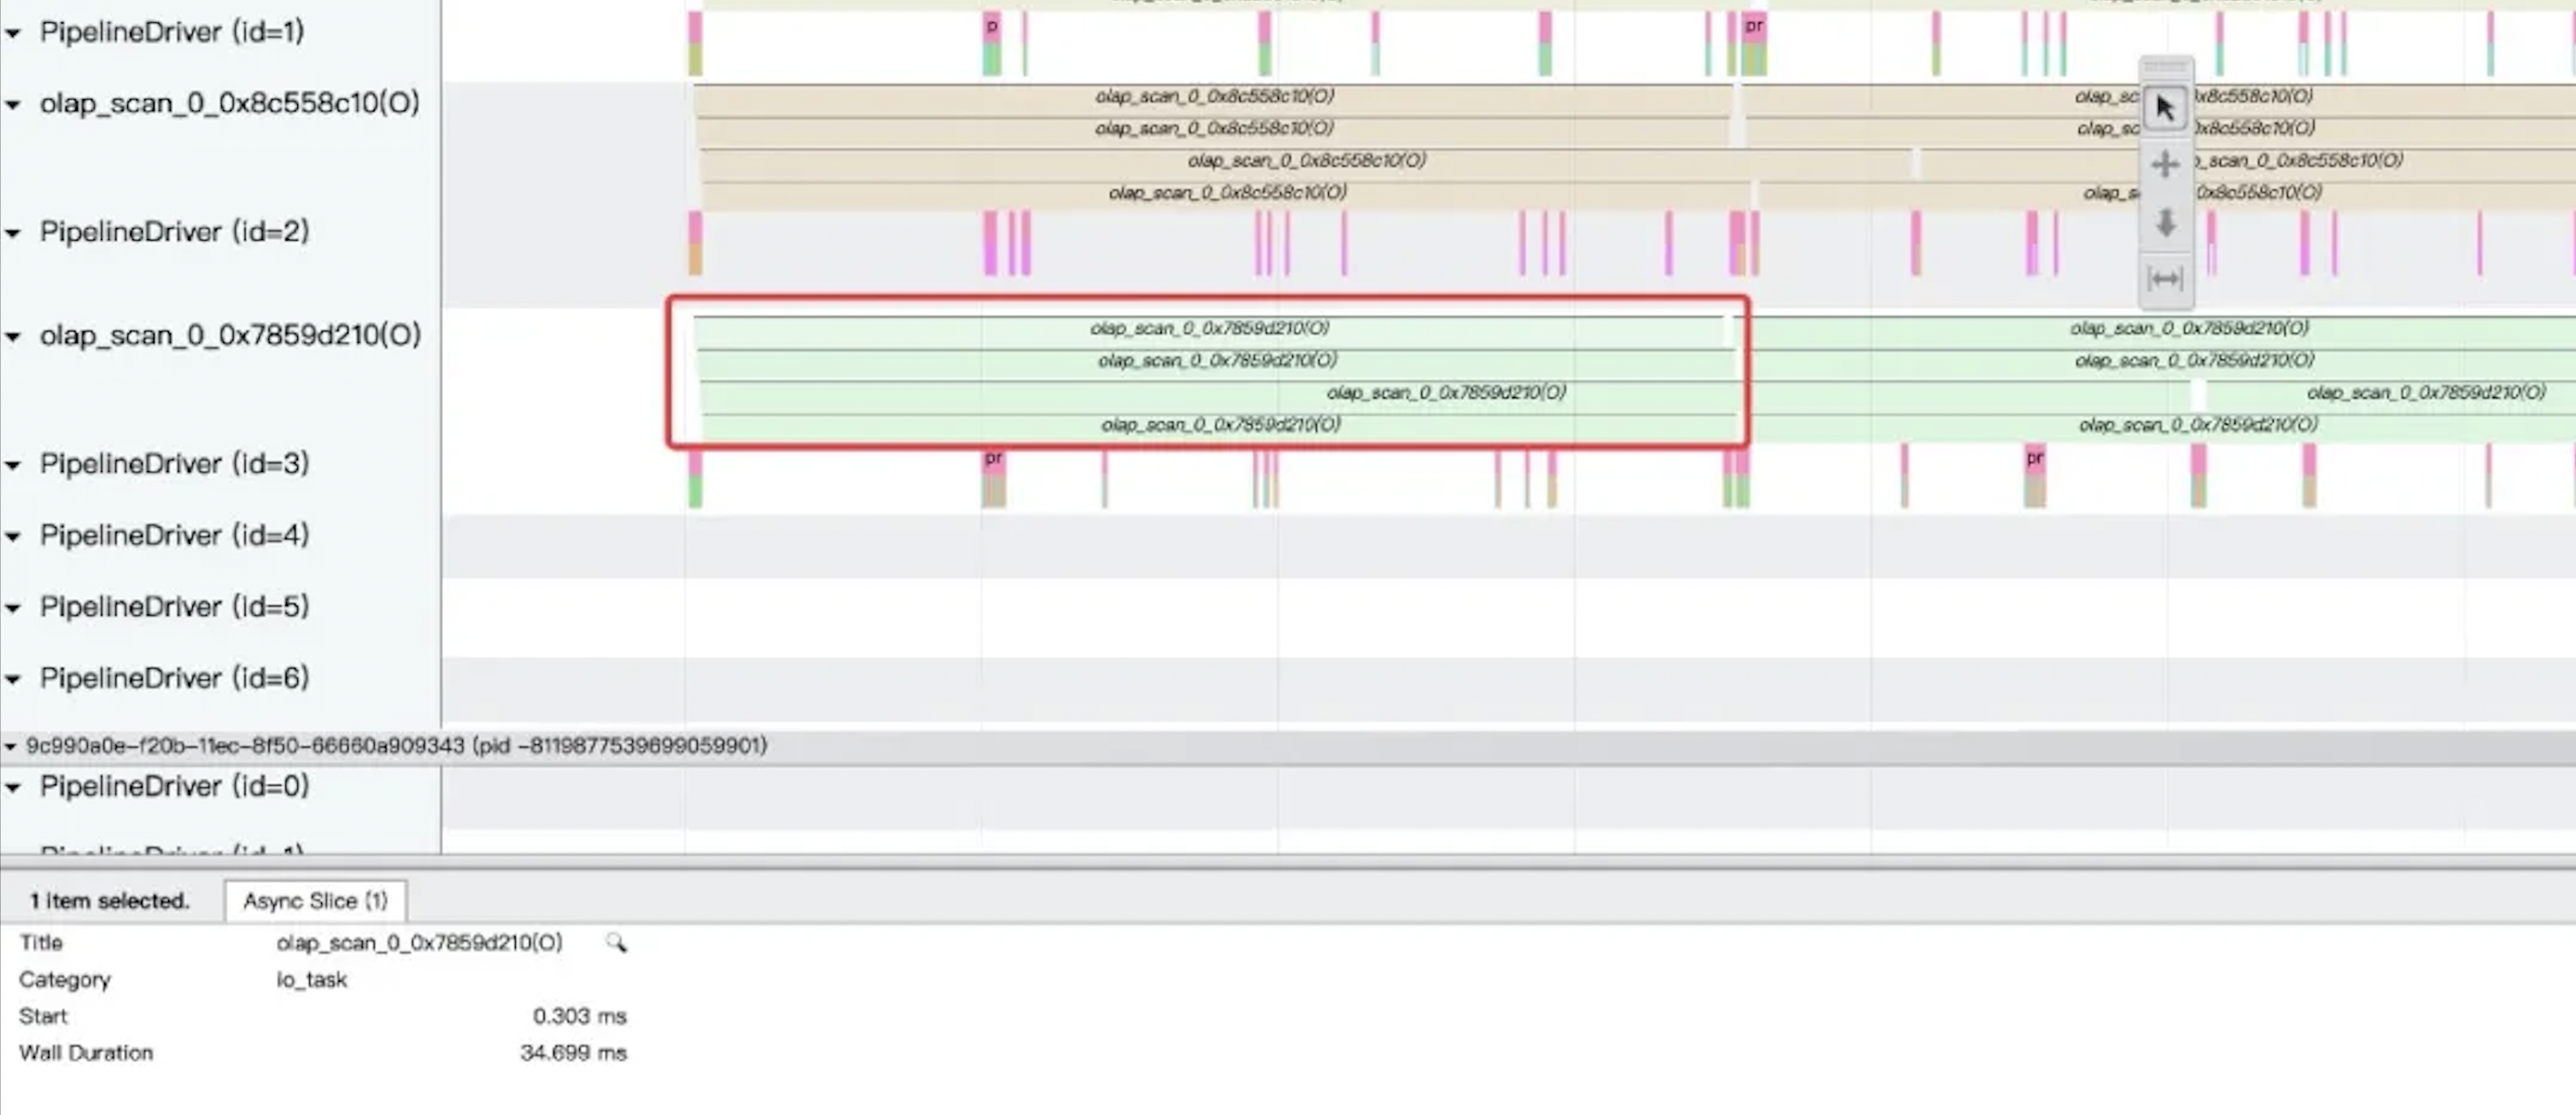
The executor trace helps identify where issues occur during query execution. It shows whether the bottleneck is associated with CPU usage, I/O, or scheduling within the execution framework, enabling faster diagnosis and targeted fixes.
3.4 CPU Sampling: Perf
In addition to the database’s built-in performance tools, we can rely on general-purpose Linux profiling utilities. One of the most widely used is Perf, which helps visualize CPU hotspots using flame graphs. For more information, see: https://www.brendangregg.com/perf.html
3.5 Off-CPU Tracing Using eBPF
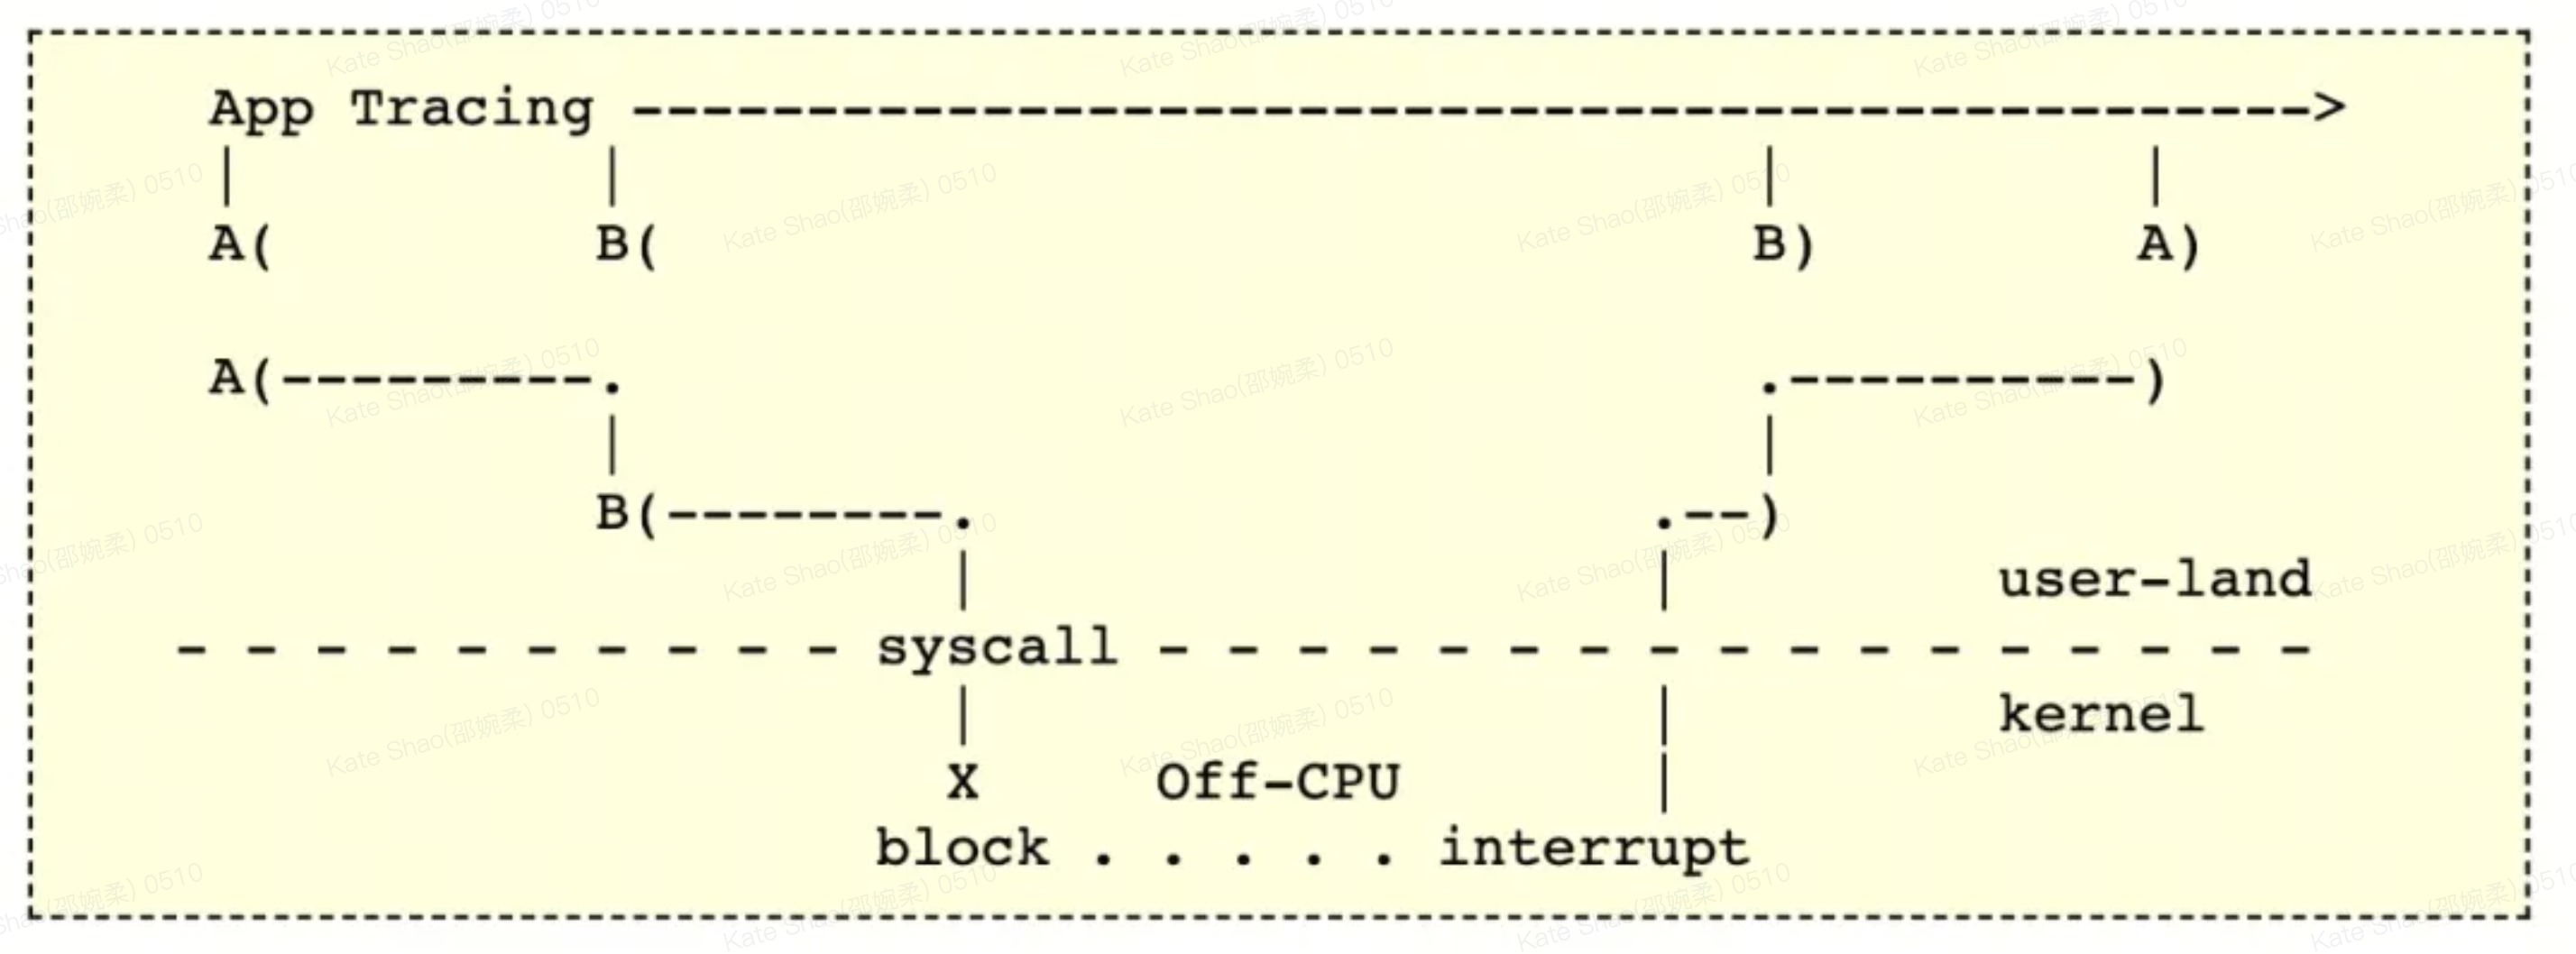
In many cases, performance bottlenecks do not come from CPU execution itself. They may be caused by I/O, network delays, or locks. In these situations, we need Off-CPU analysis. Sampling-based profiling tools are often ineffective for this, so we rely on trace-based tools such as eBPF. For more information, see: https://www.brendangregg.com/offcpuanalysis.html
3.6 Intel’s Top-Down Analysis Method
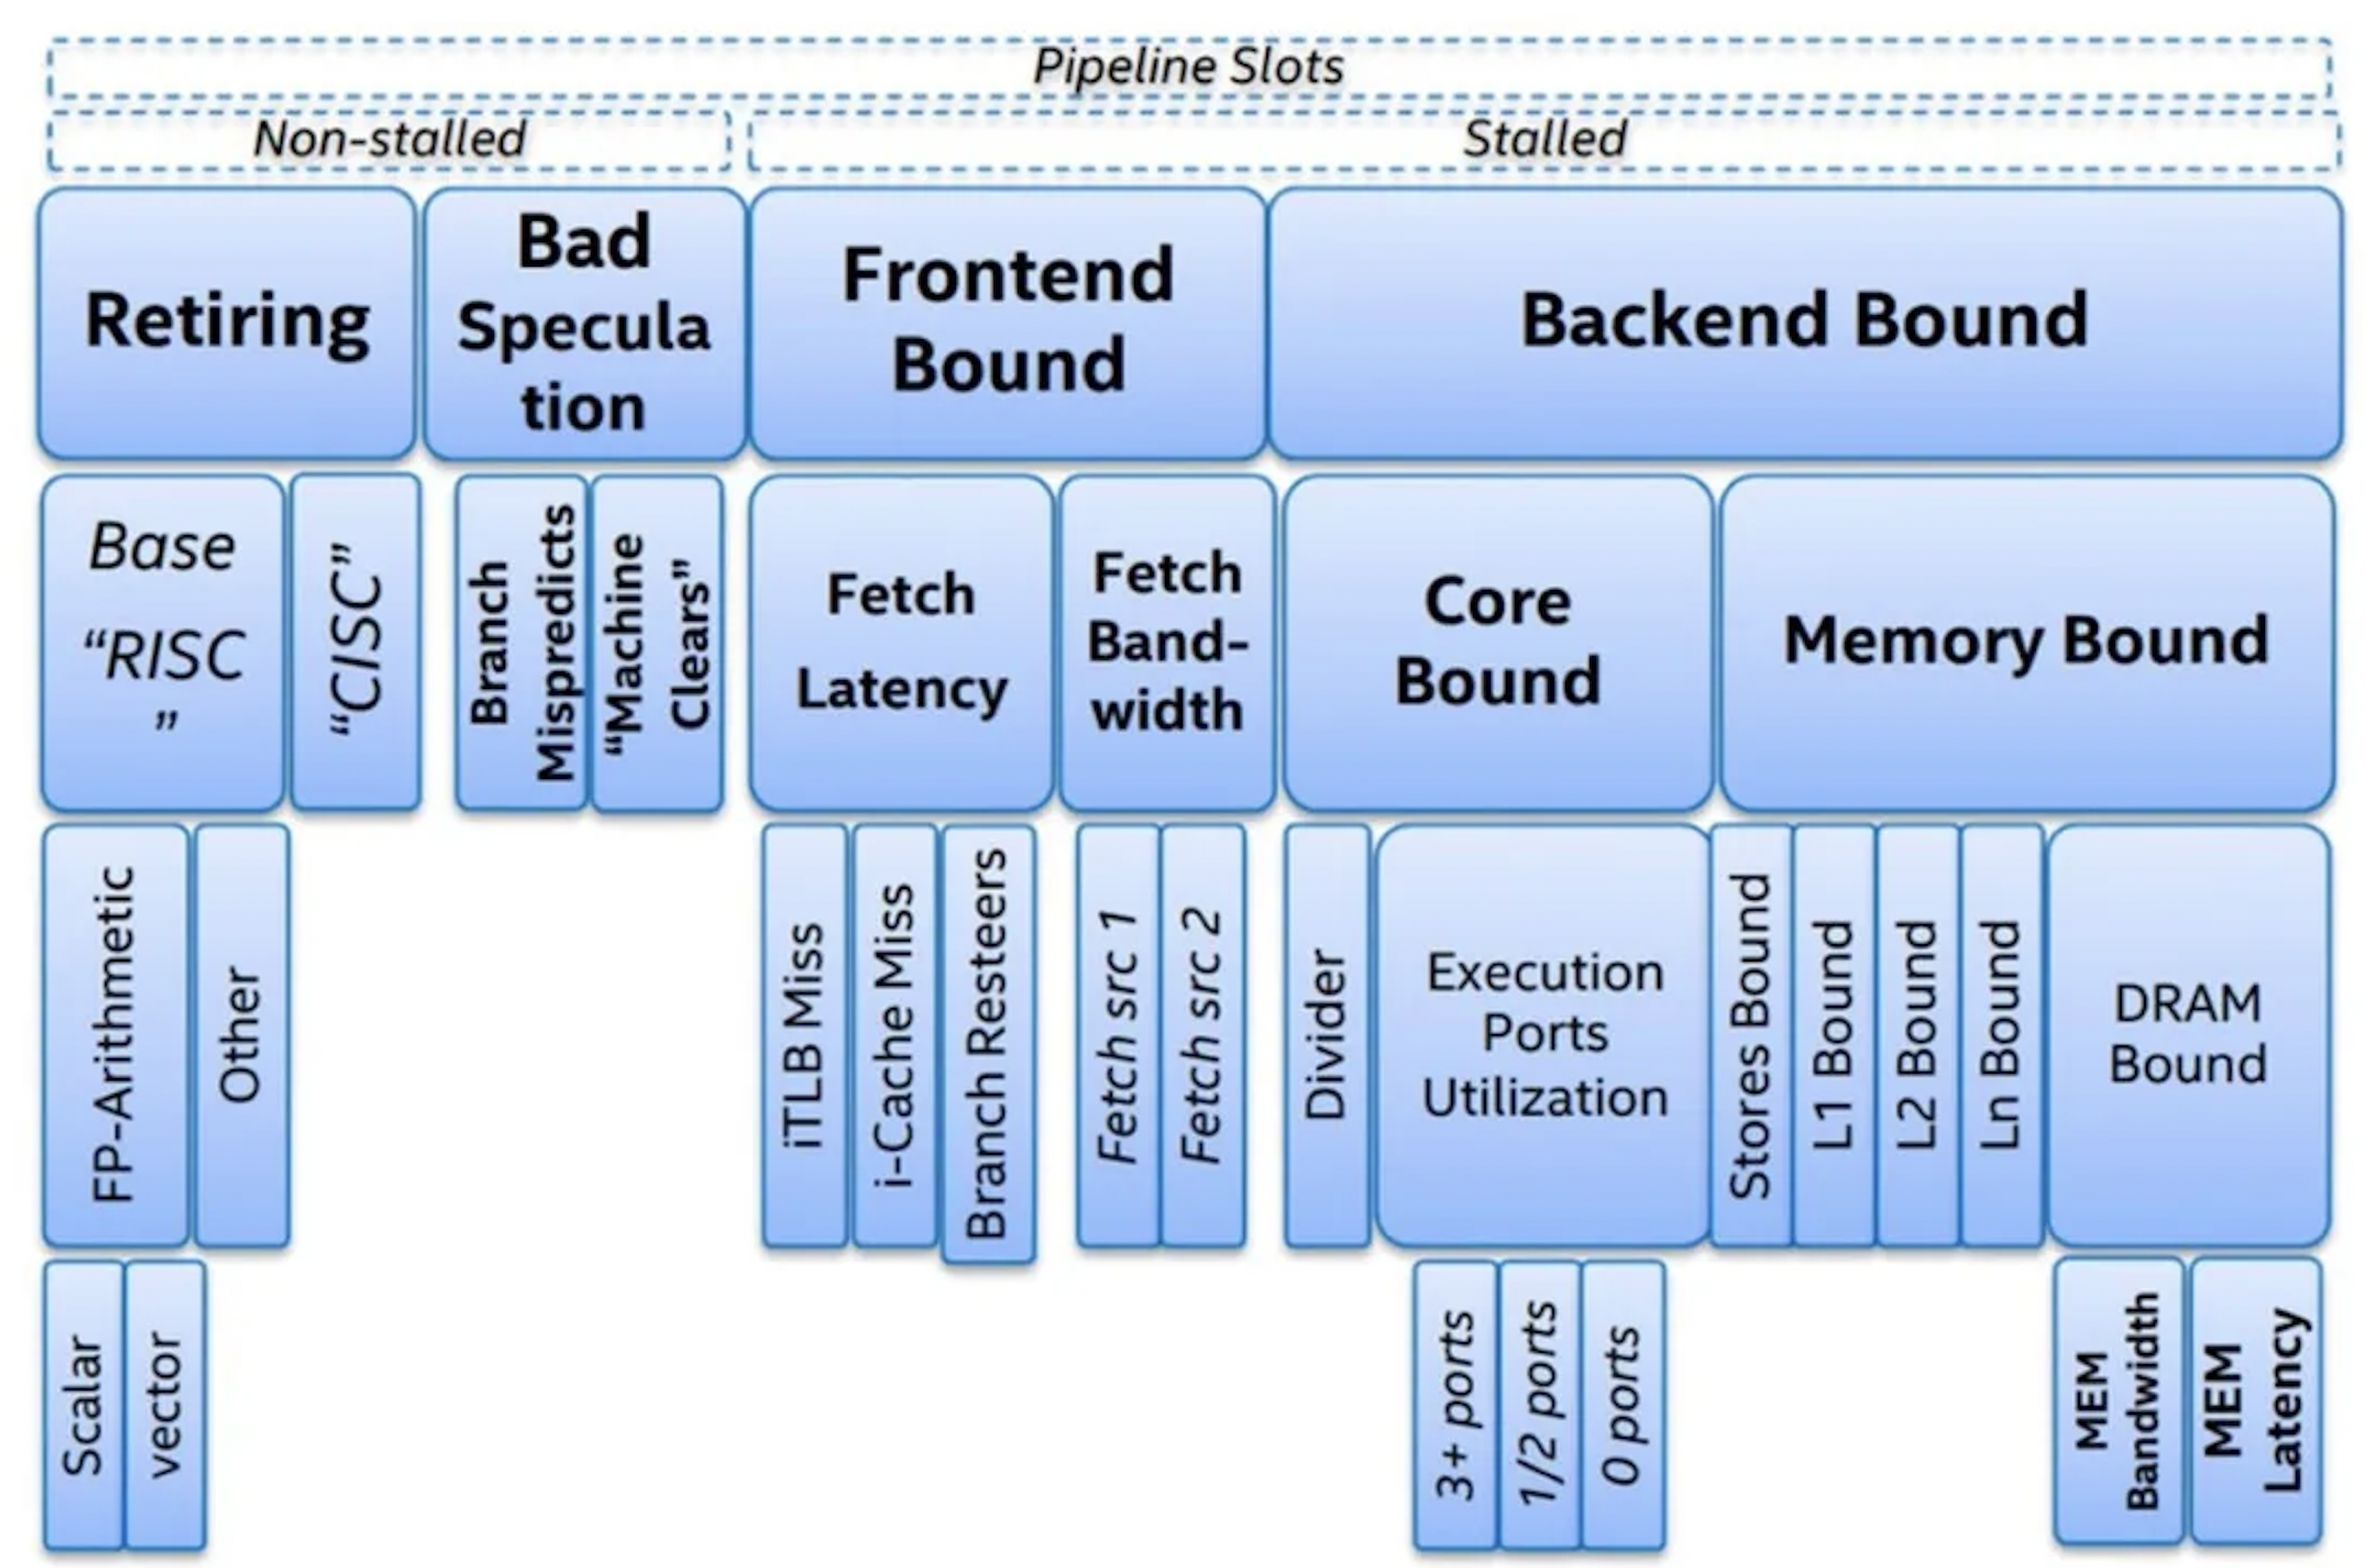
As shown above, Intel introduced the Top-Down Microarchitecture Analysis Method, a structured way to analyze CPU microarchitectural performance. It breaks down potential bottlenecks into four major categories, each of which can be further subdivided to help you drill down step by step until you identify the root cause.
To make the idea more intuitive, we can simplify the diagram as follows (note that this is not strictly precise):
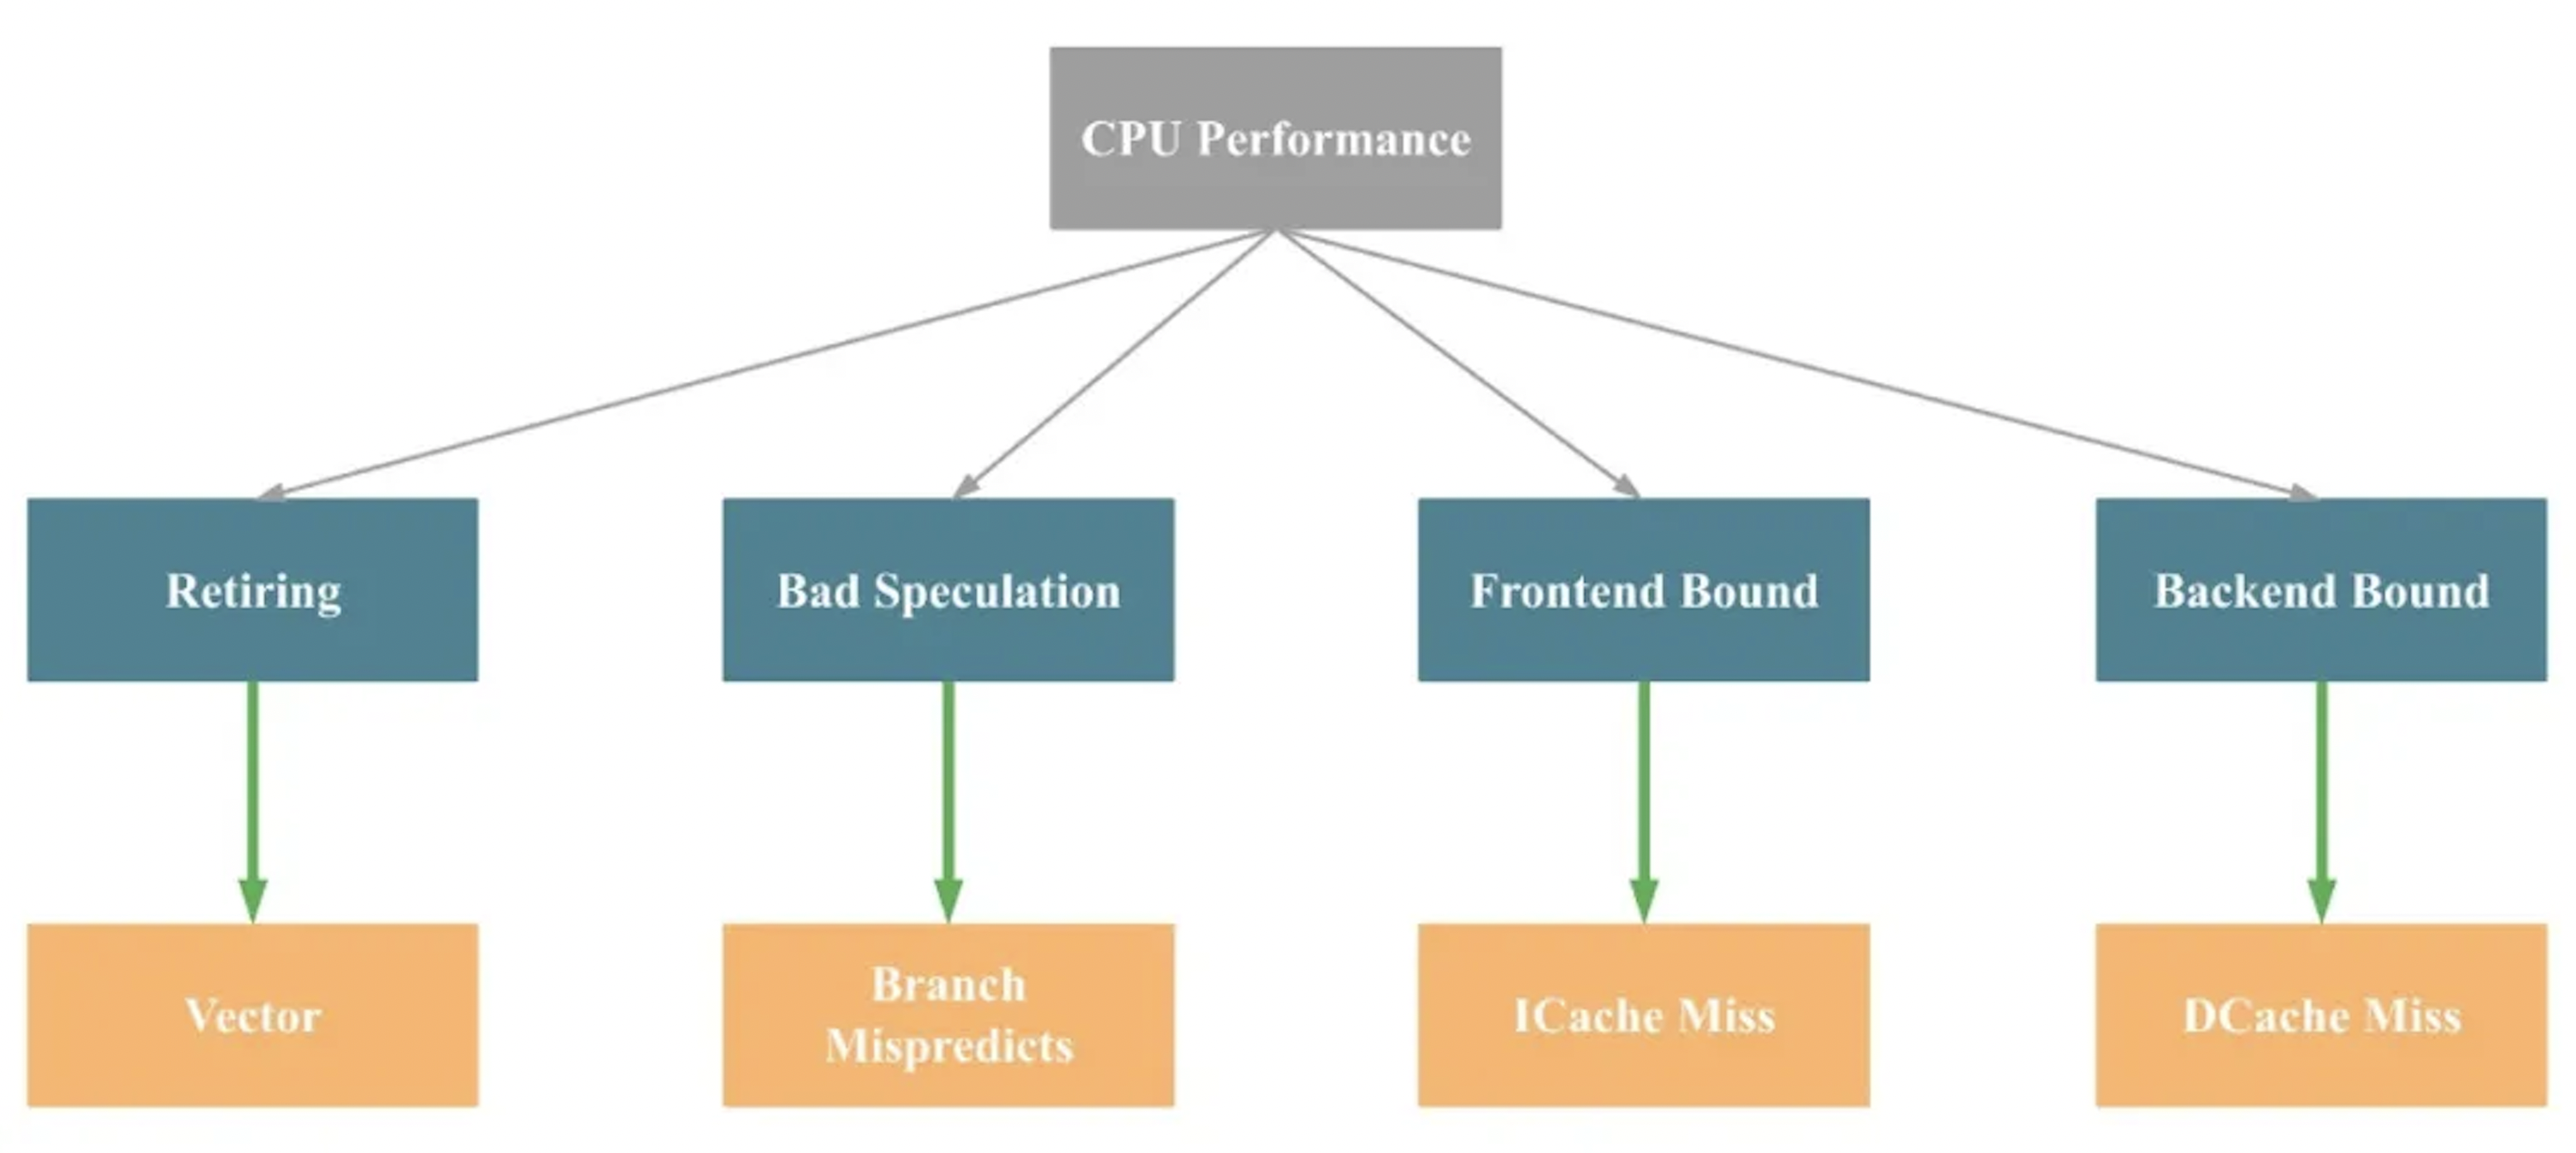
In short, the main CPU bottlenecks in a program typically fall into four groups: Retiring, Bad Speculation, Frontend Bound, and Backend Bound. The common underlying causes (again, simplified and not strictly precise) are: limited SIMD optimization, branch mispredictions, instruction cache misses, and data cache misses, respectively.
3.7 Linux Performance Tools
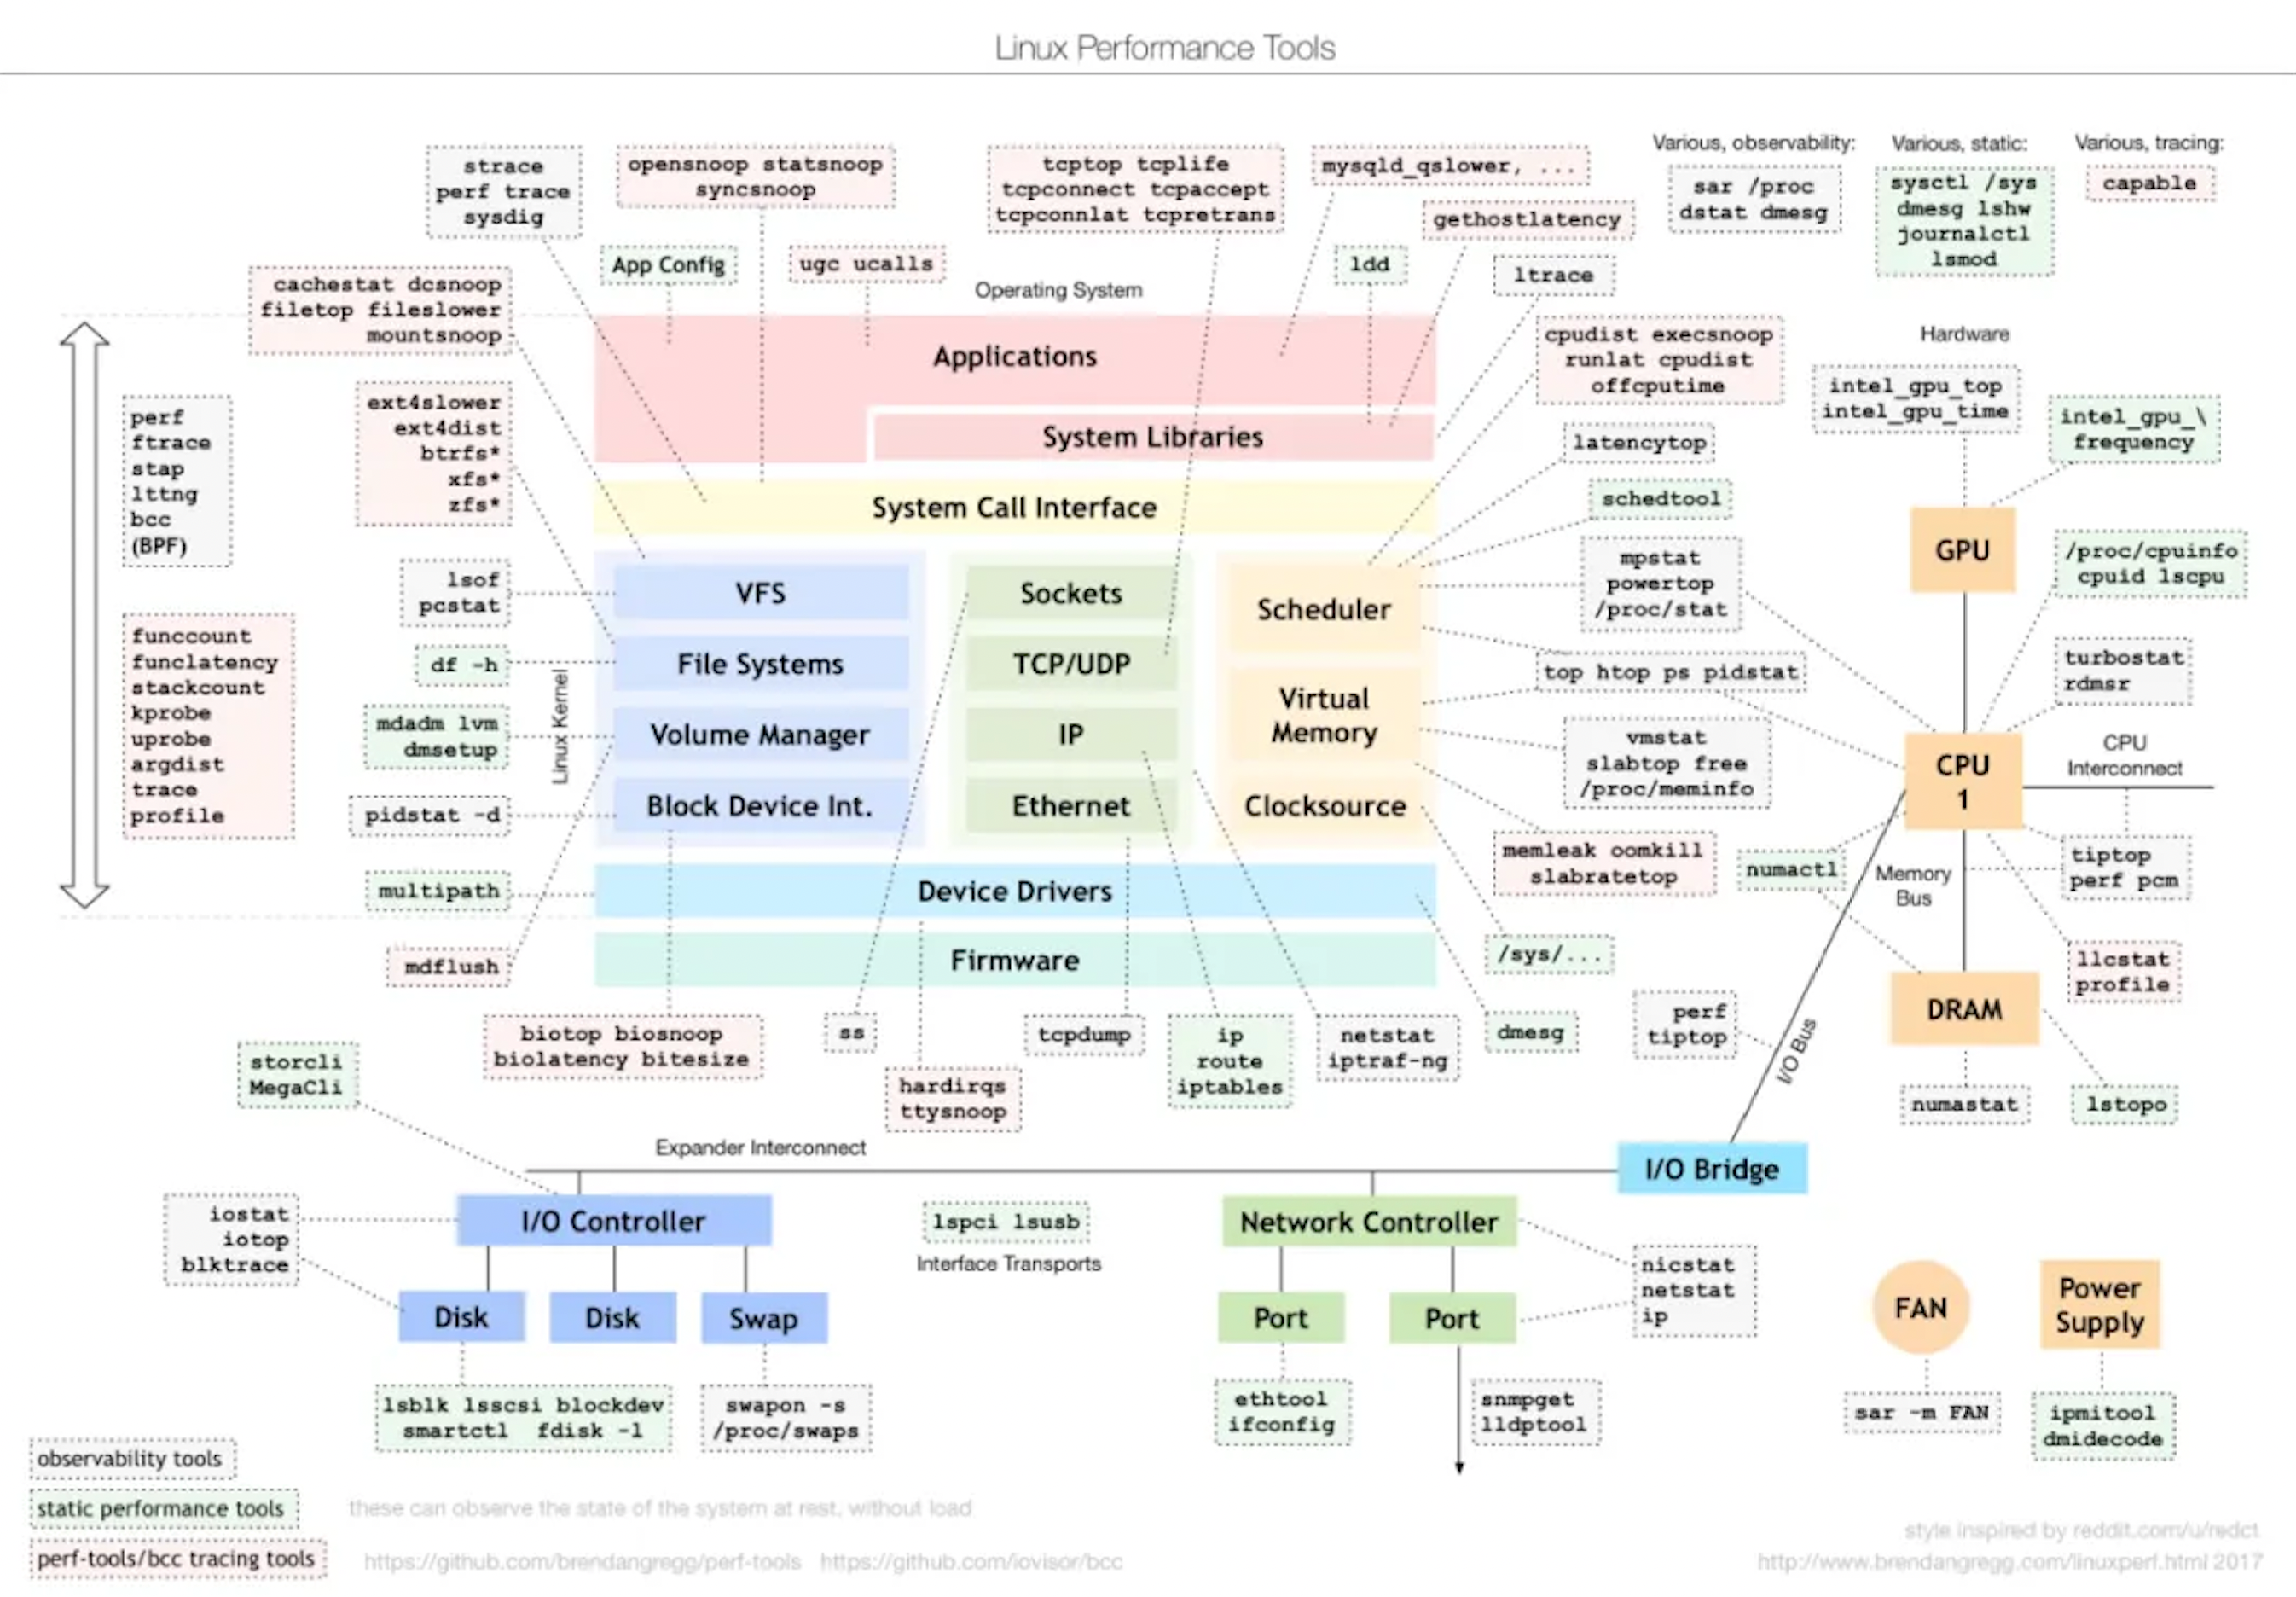
As shown above, each part of the operating system has corresponding tools that can be used for performance analysis. In day-to-day work, it is important to develop familiarity with these tools, understand which ones apply to different types of issues, and know what problems each key tool is designed to solve.
3.8 Performance Monitoring Metrics
The comprehensive exposure of database system performance monitoring metrics throughout the entire query process is an important characteristic that makes it much easier to analyze performance bottlenecks for specific types of issues. This design is particularly friendly for database administrators, solution engineers, and regular users. For details, please refer to relevant technical documentation.
3.9 Optimizer Plan Testing
SQL is declarative: it describes what needs to be done, not how to do it. Therefore, a single SQL statement may have thousands or even tens of thousands of possible execution paths. The plan chosen by the optimizer is often not optimal, and even experienced engineers cannot always determine which plan is truly the best.
There are two main reasons for this:
-
The space of possible execution plans is far too large to evaluate manually.
-
The real performance of a plan depends on many factors, including operator-level efficiency in the executor, cluster size, data distribution, and hardware resources.
This is why we need a dedicated optimizer plan testing tool that can enumerate different execution plans, measure their actual runtime performance, and help uncover better alternatives.
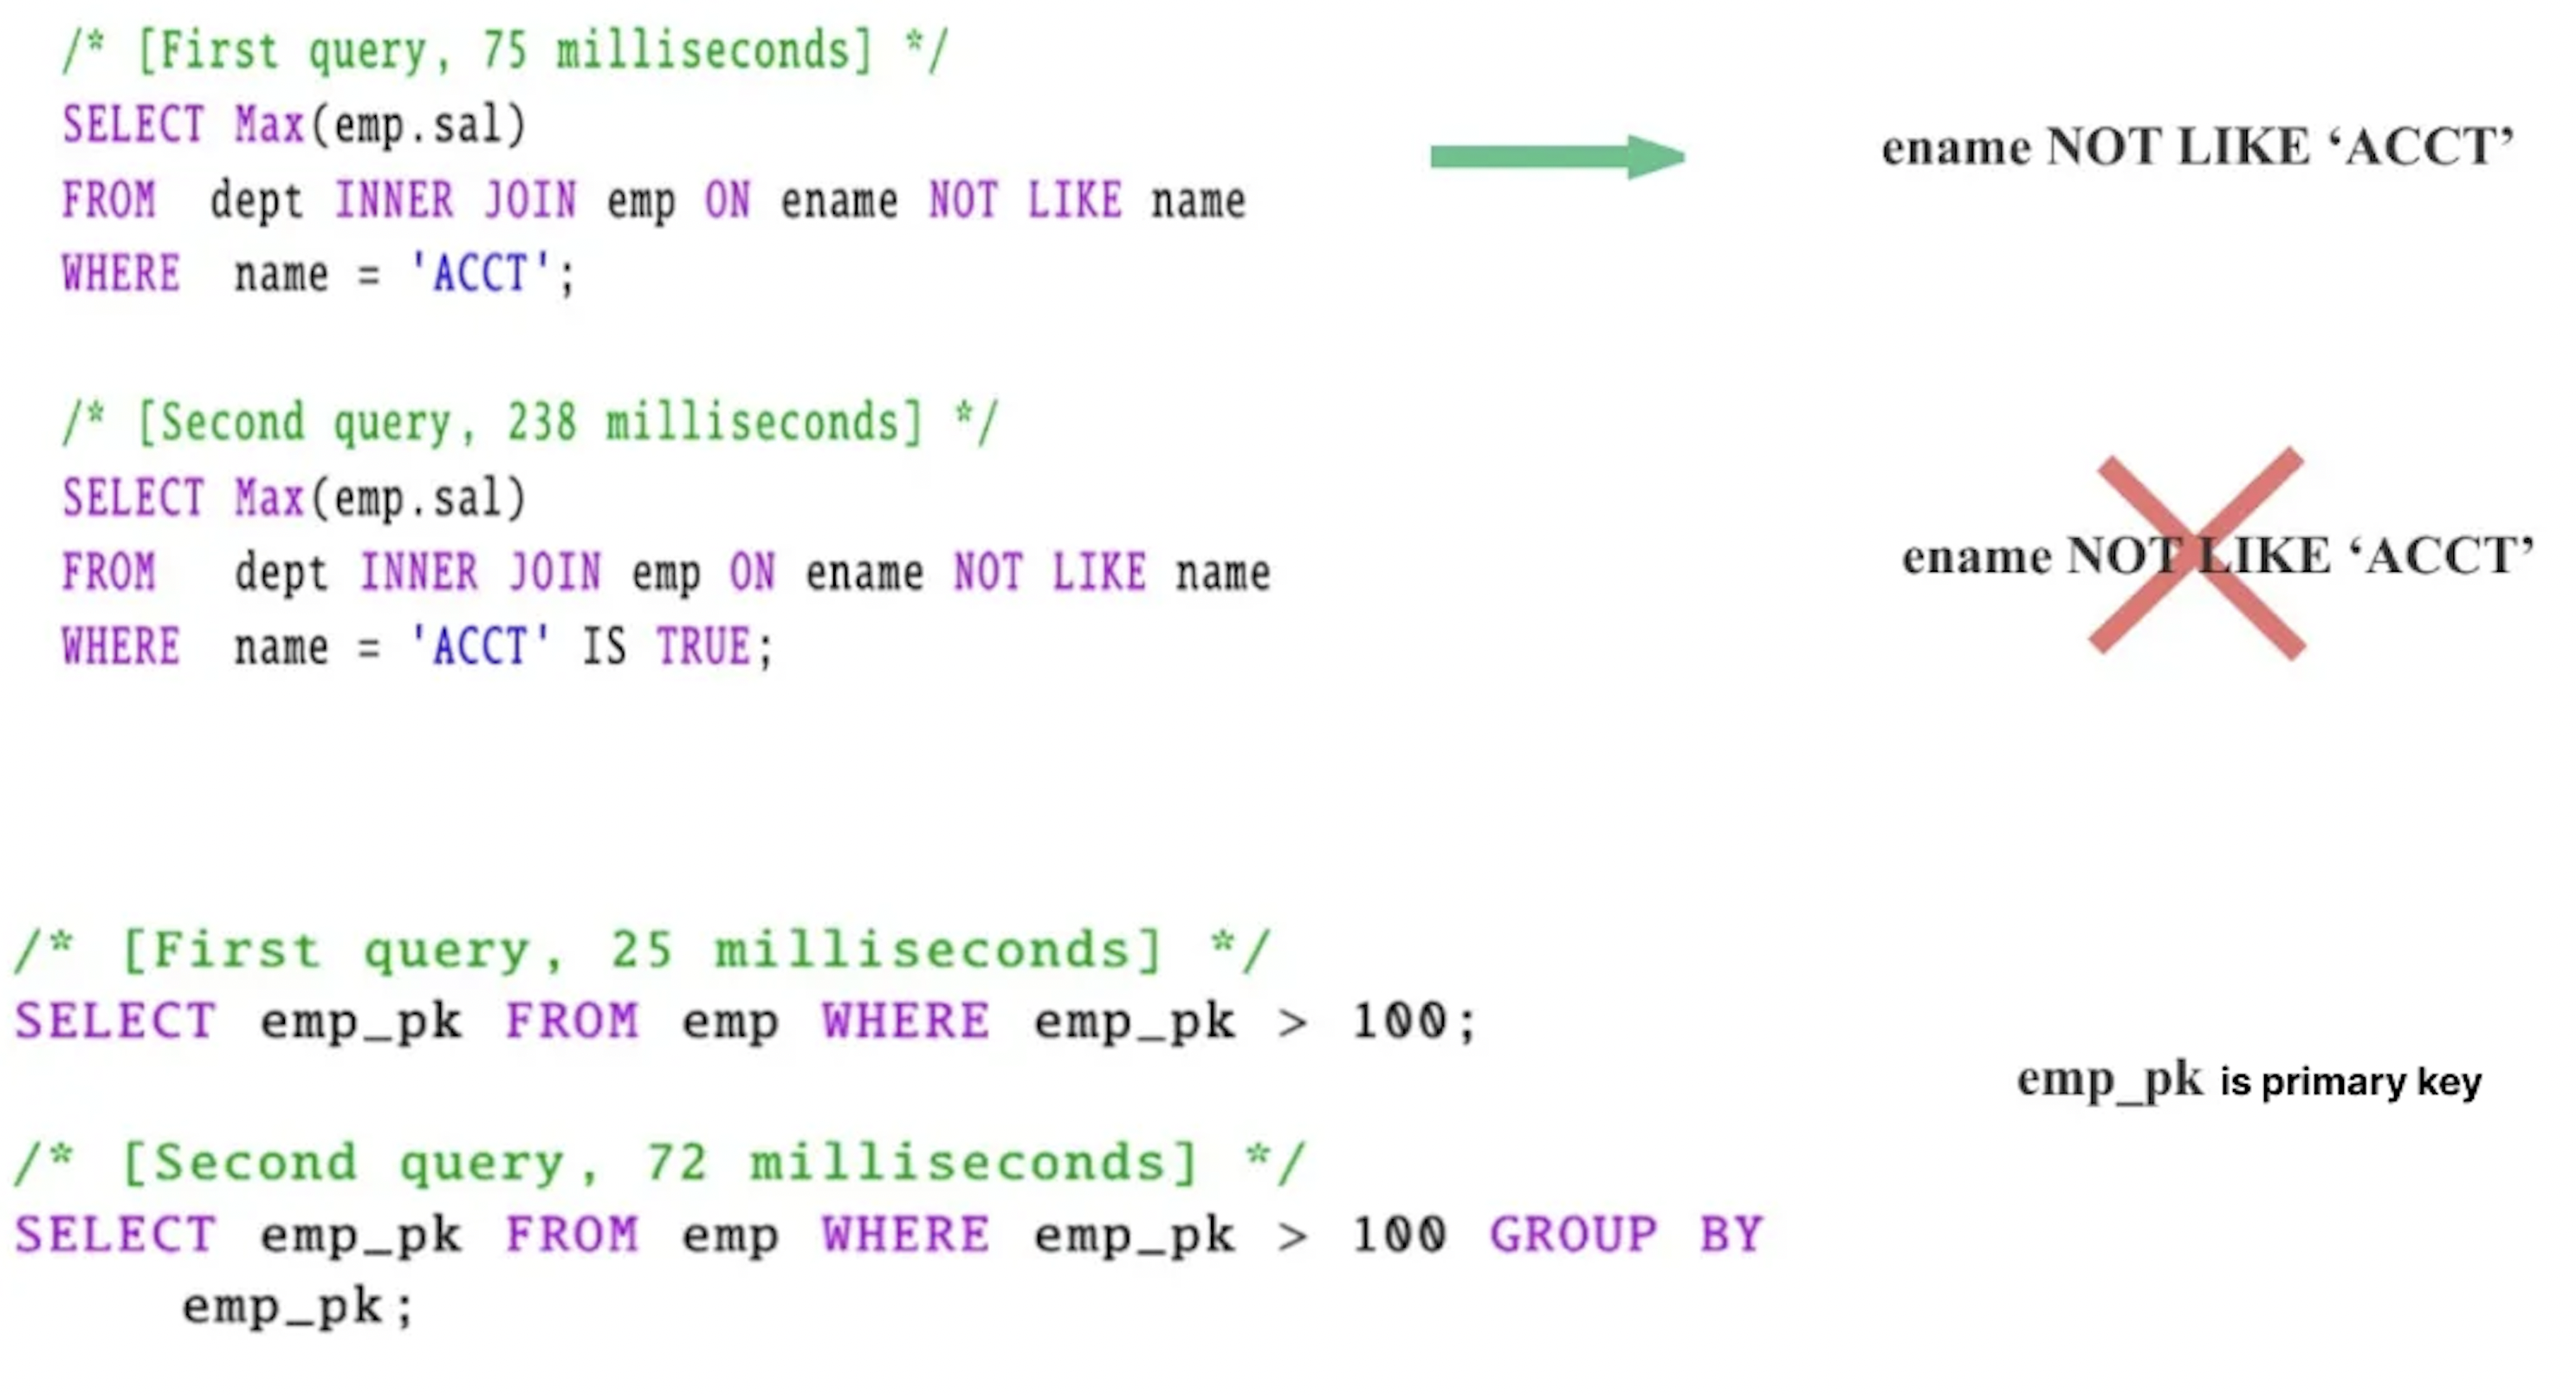
As shown in the figure above, the two SQL statements at the top are logically equivalent. Still, many databases fail to infer the predicate
ename NOT LIKE 'ACCT'In the two SQL statements below, if the optimizer knows that
emp_pk is a primary key, then GROUP BY emp_pk can be eliminated, which also yields a 3× performance improvement.4. How to Perform Query Performance Optimization
4.1 General CPU-Level Performance Optimization
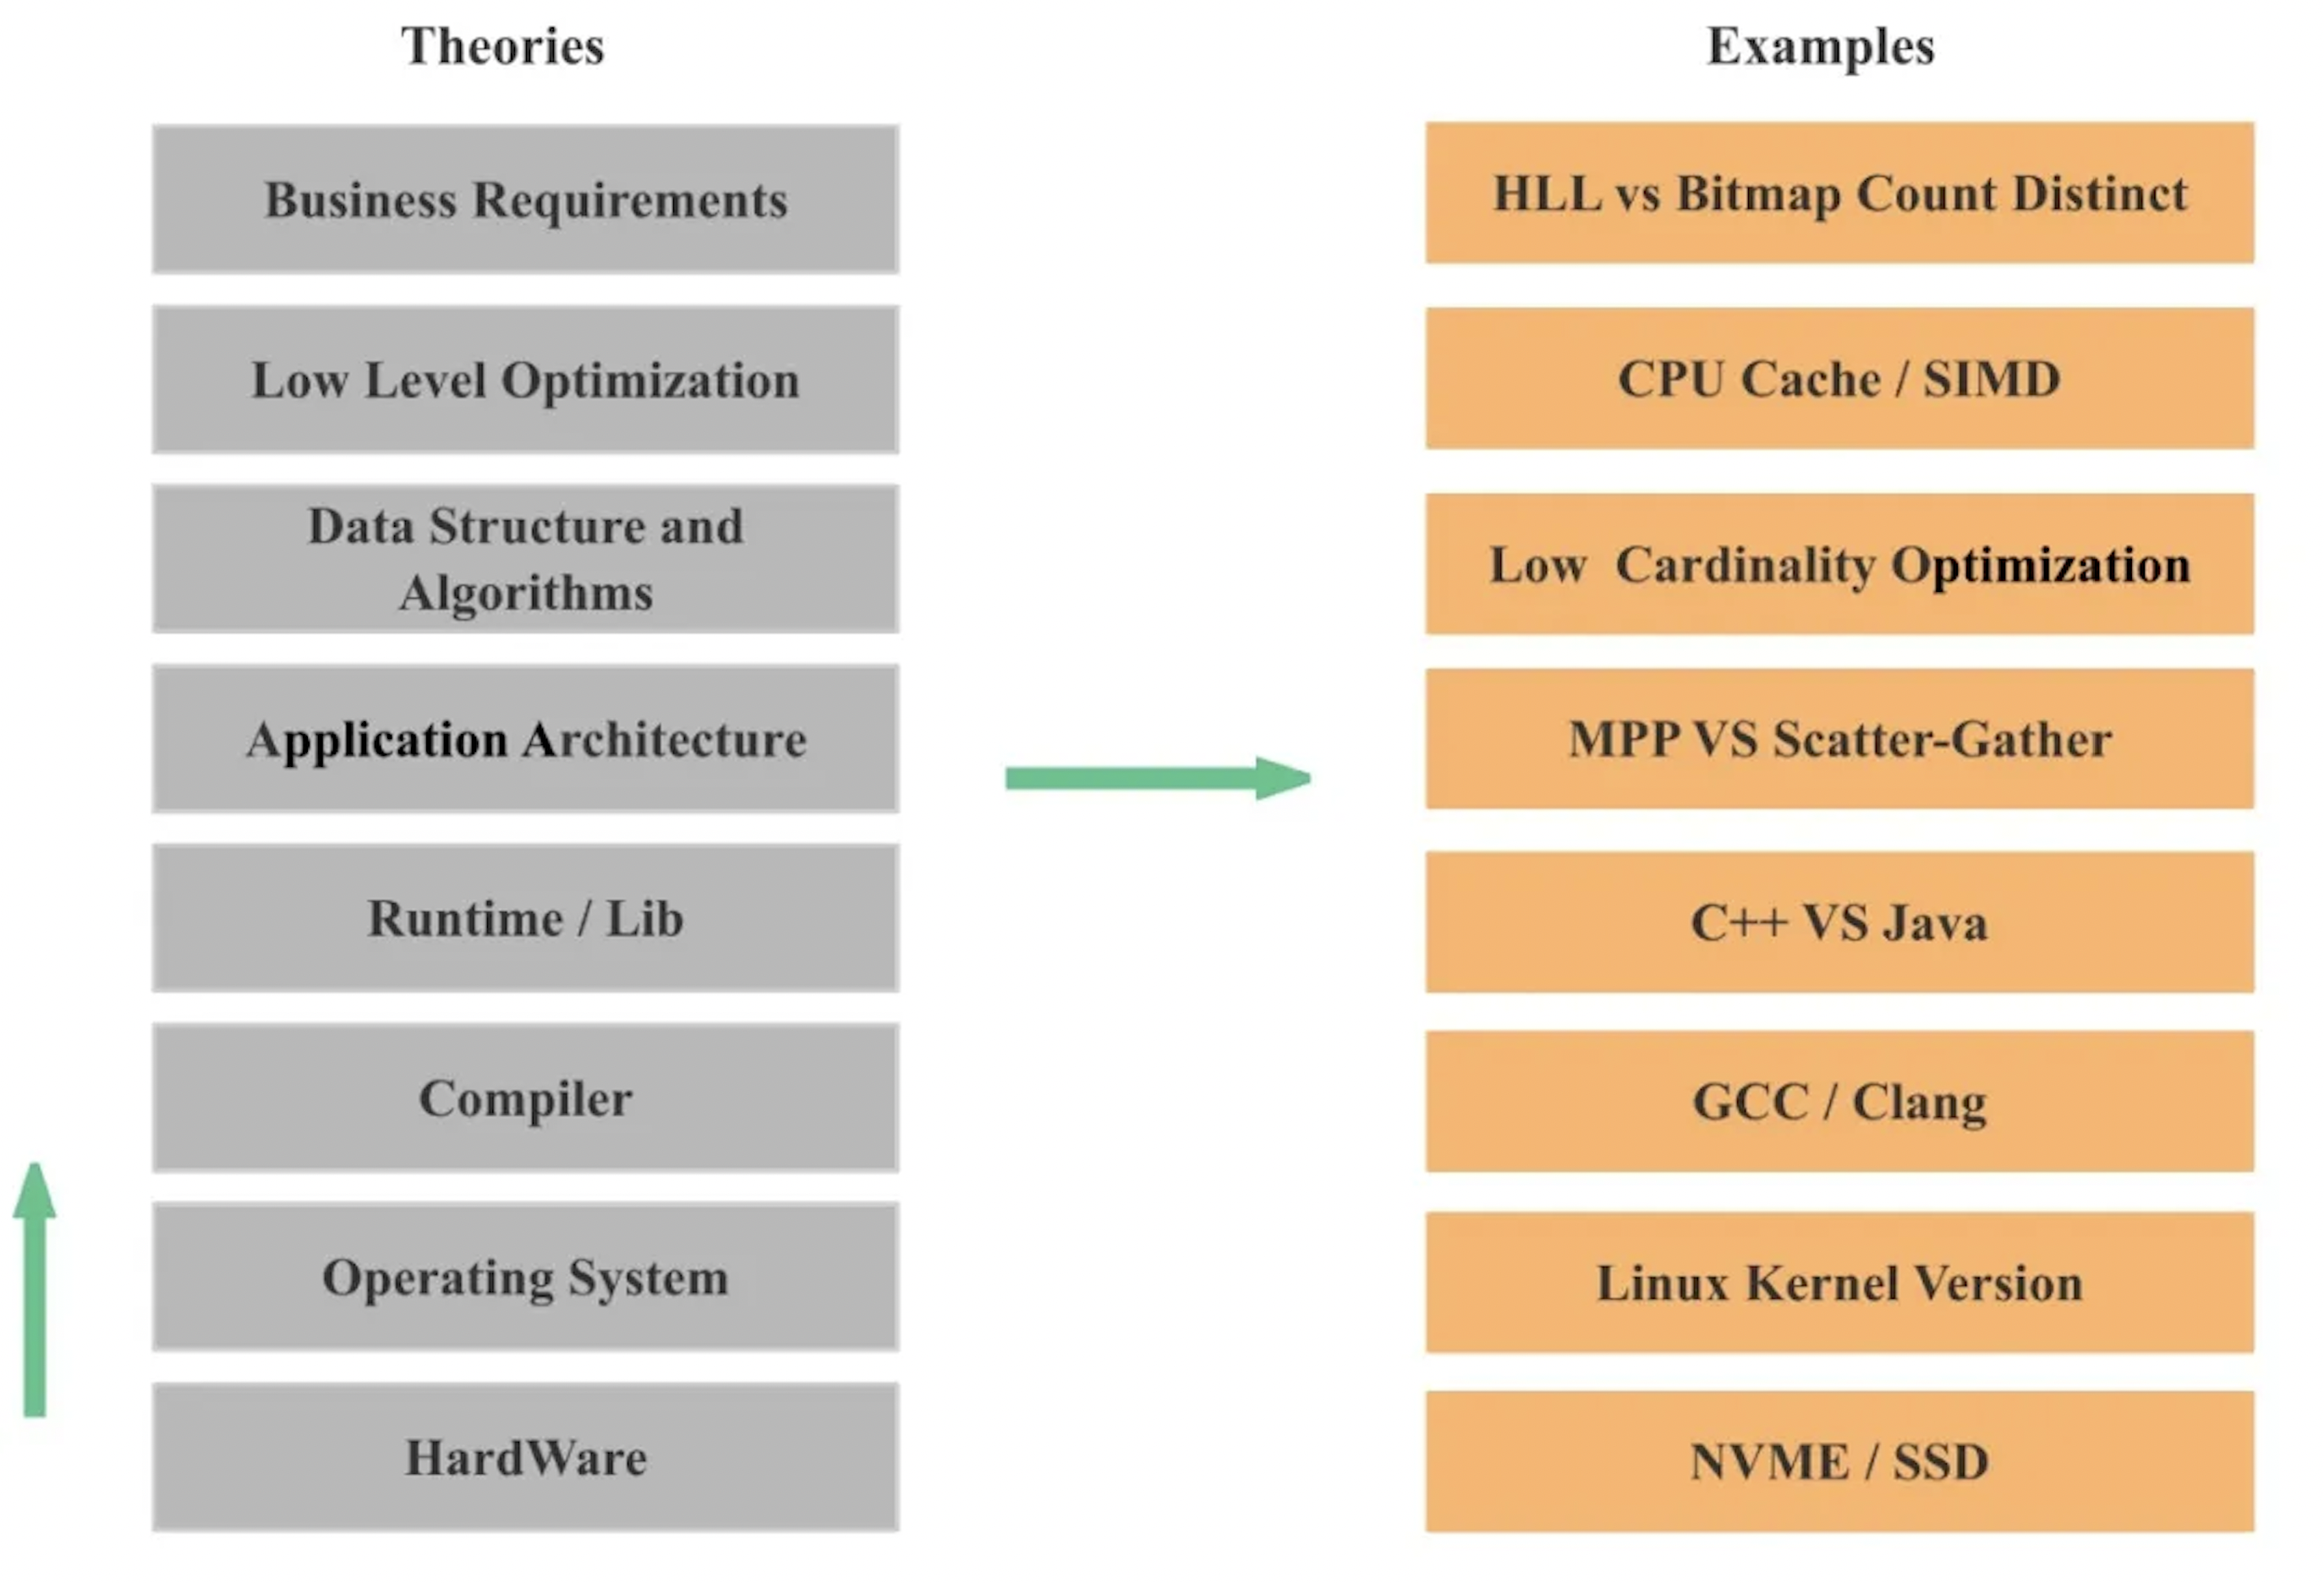
As shown in the diagram above, a database is essentially a large-scale CPU-intensive application. Therefore, we can start by applying the same general optimization principles used for CPU programs to improve database query performance. From the bottom up, we can optimize across several layers:
-
Hardware: This includes directly upgrading hardware, such as replacing HDDs with NVMe or SSDs. To fully leverage new hardware, we often need to optimize system architecture, data structures, and algorithms accordingly.
-
Operating system: Kernel upgrades frequently bring new features and performance improvements, such as the
io_uringasynchronous I/O interface. -
Compiler: Compilers continuously introduce optimizations. Code that cannot be auto-vectorized in older versions may be automatically vectorized in newer ones.
-
Programming languages and third-party libraries: Different languages have different inherent performance characteristics. Even within the same language, there are many performance optimization techniques.
-
Application architecture: Architecture directly affects scalability and can significantly impact performance. For example, MPP vs. scatter–gather execution models.
-
Data structures and algorithms: Different data structures and algorithms often produce order-of-magnitude performance differences. A classic example is the continuous evolution of hash table optimizations in industry over the past decades.
-
Low-level optimizations: These include techniques such as SIMD and CPU cache optimizations.
-
Business logic optimization: Sometimes performance gains come from changes in logic, such as switching from exact deduplication to approximate deduplication, or optimizing data modeling.
4.2 Database Preprocessing vs. Runtime Processing
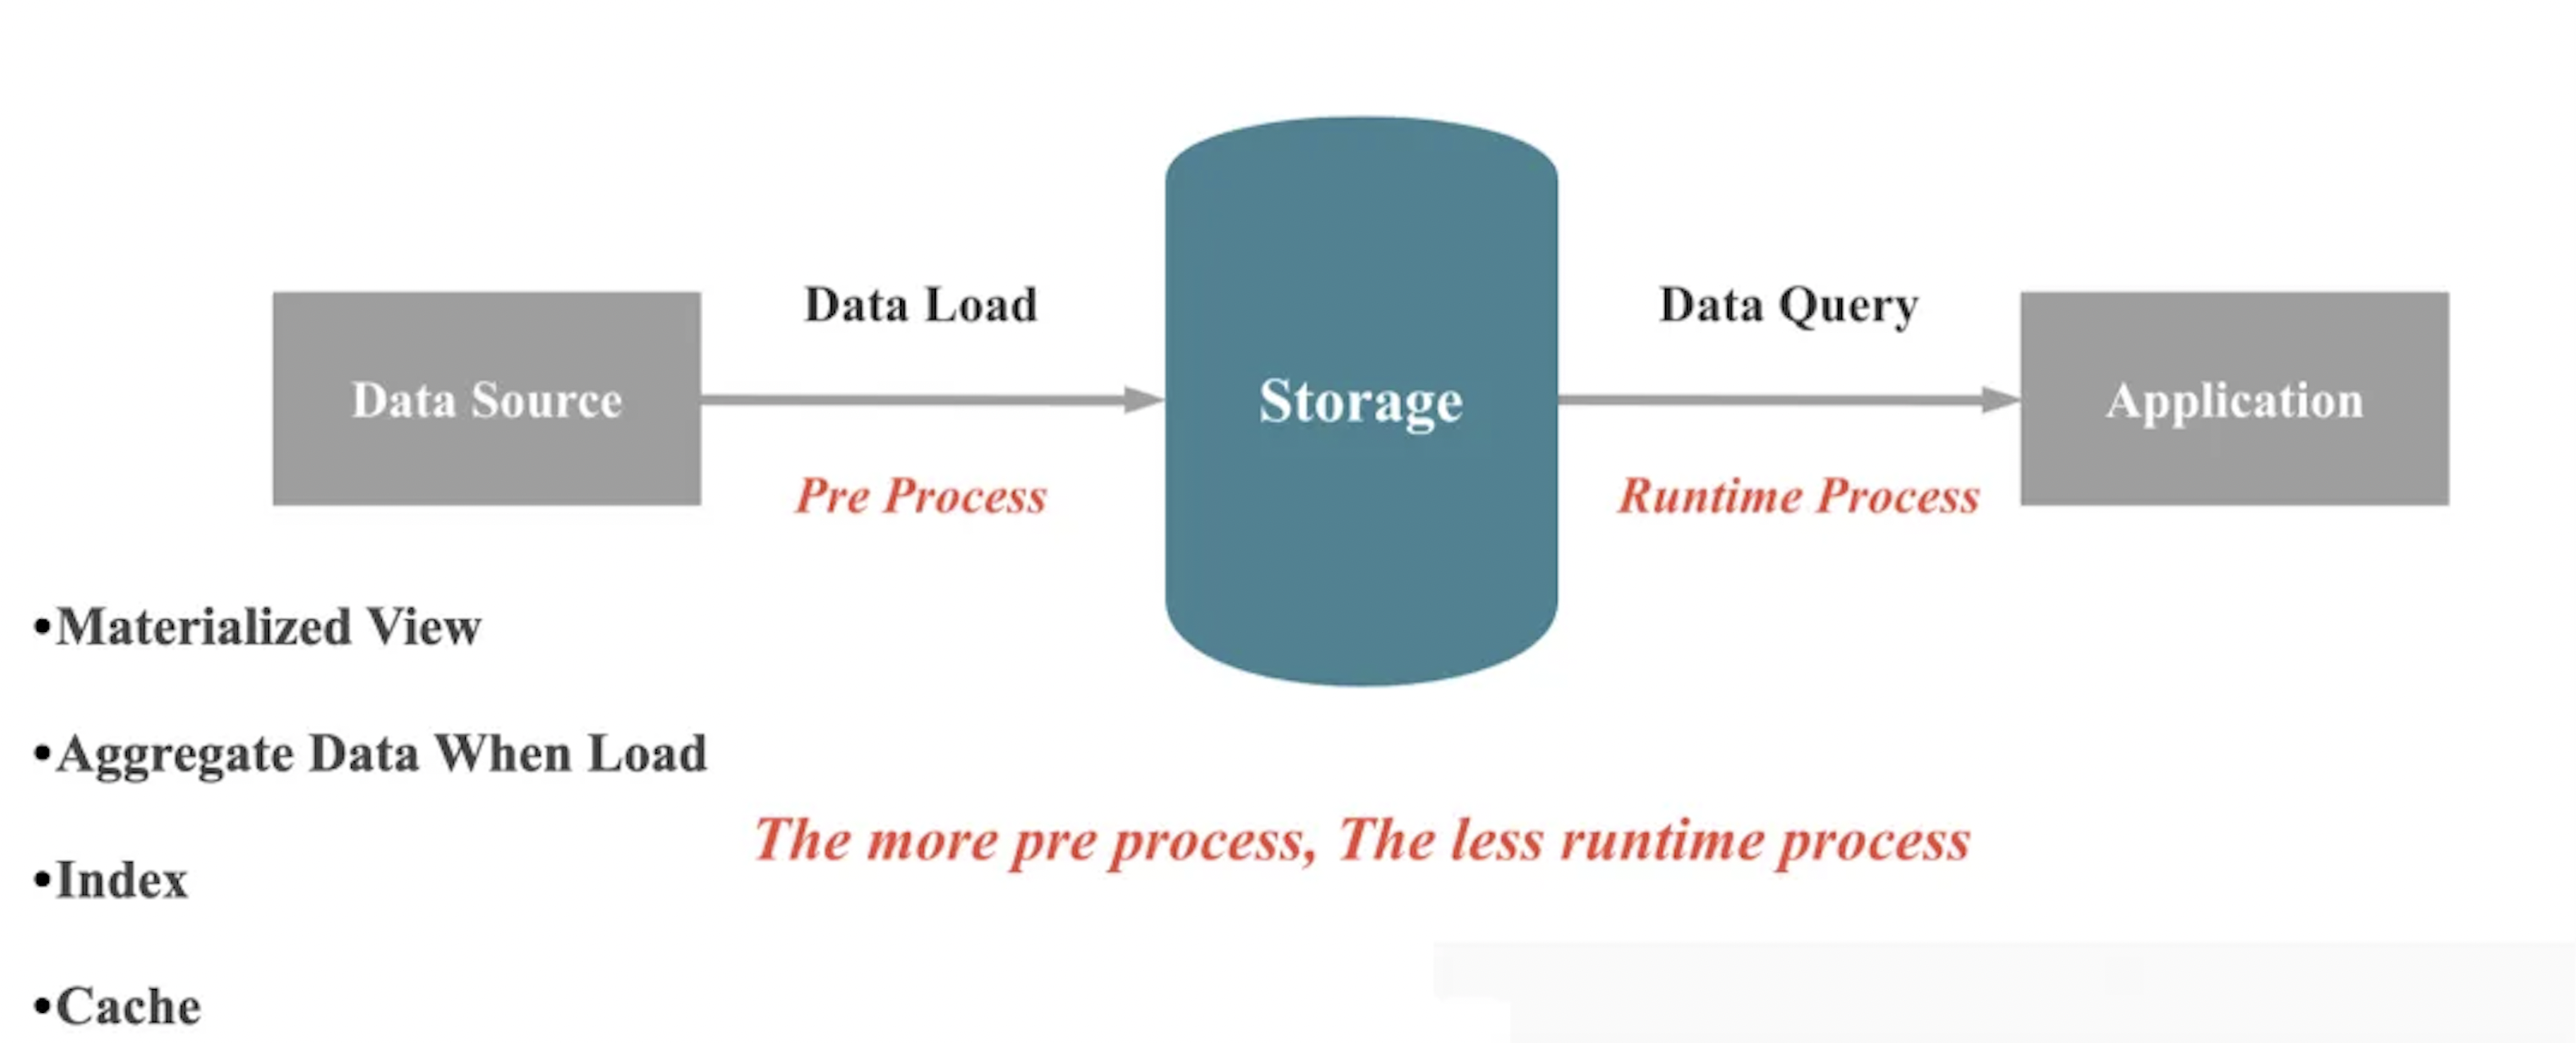
At its core, a database does two things: store data and query data. When data is written into a database, the system ensures durability and correctness. When we query or analyze data, the database is responsible for returning accurate results quickly.
As shown in the figure above, when on-the-fly compute capacity remains unchanged, there are two broad ways to improve query performance:
-
Perform preprocessing during data ingestion to reduce runtime computation.
-
Trade storage space for time during data storage to lower runtime computation cost.
These strategies can be further categorized into four major techniques: materialized views, pre-aggregation, indexes, and caching. I will explore each of these in more detail in a separate article.
4.3 Database High-Level Optimization
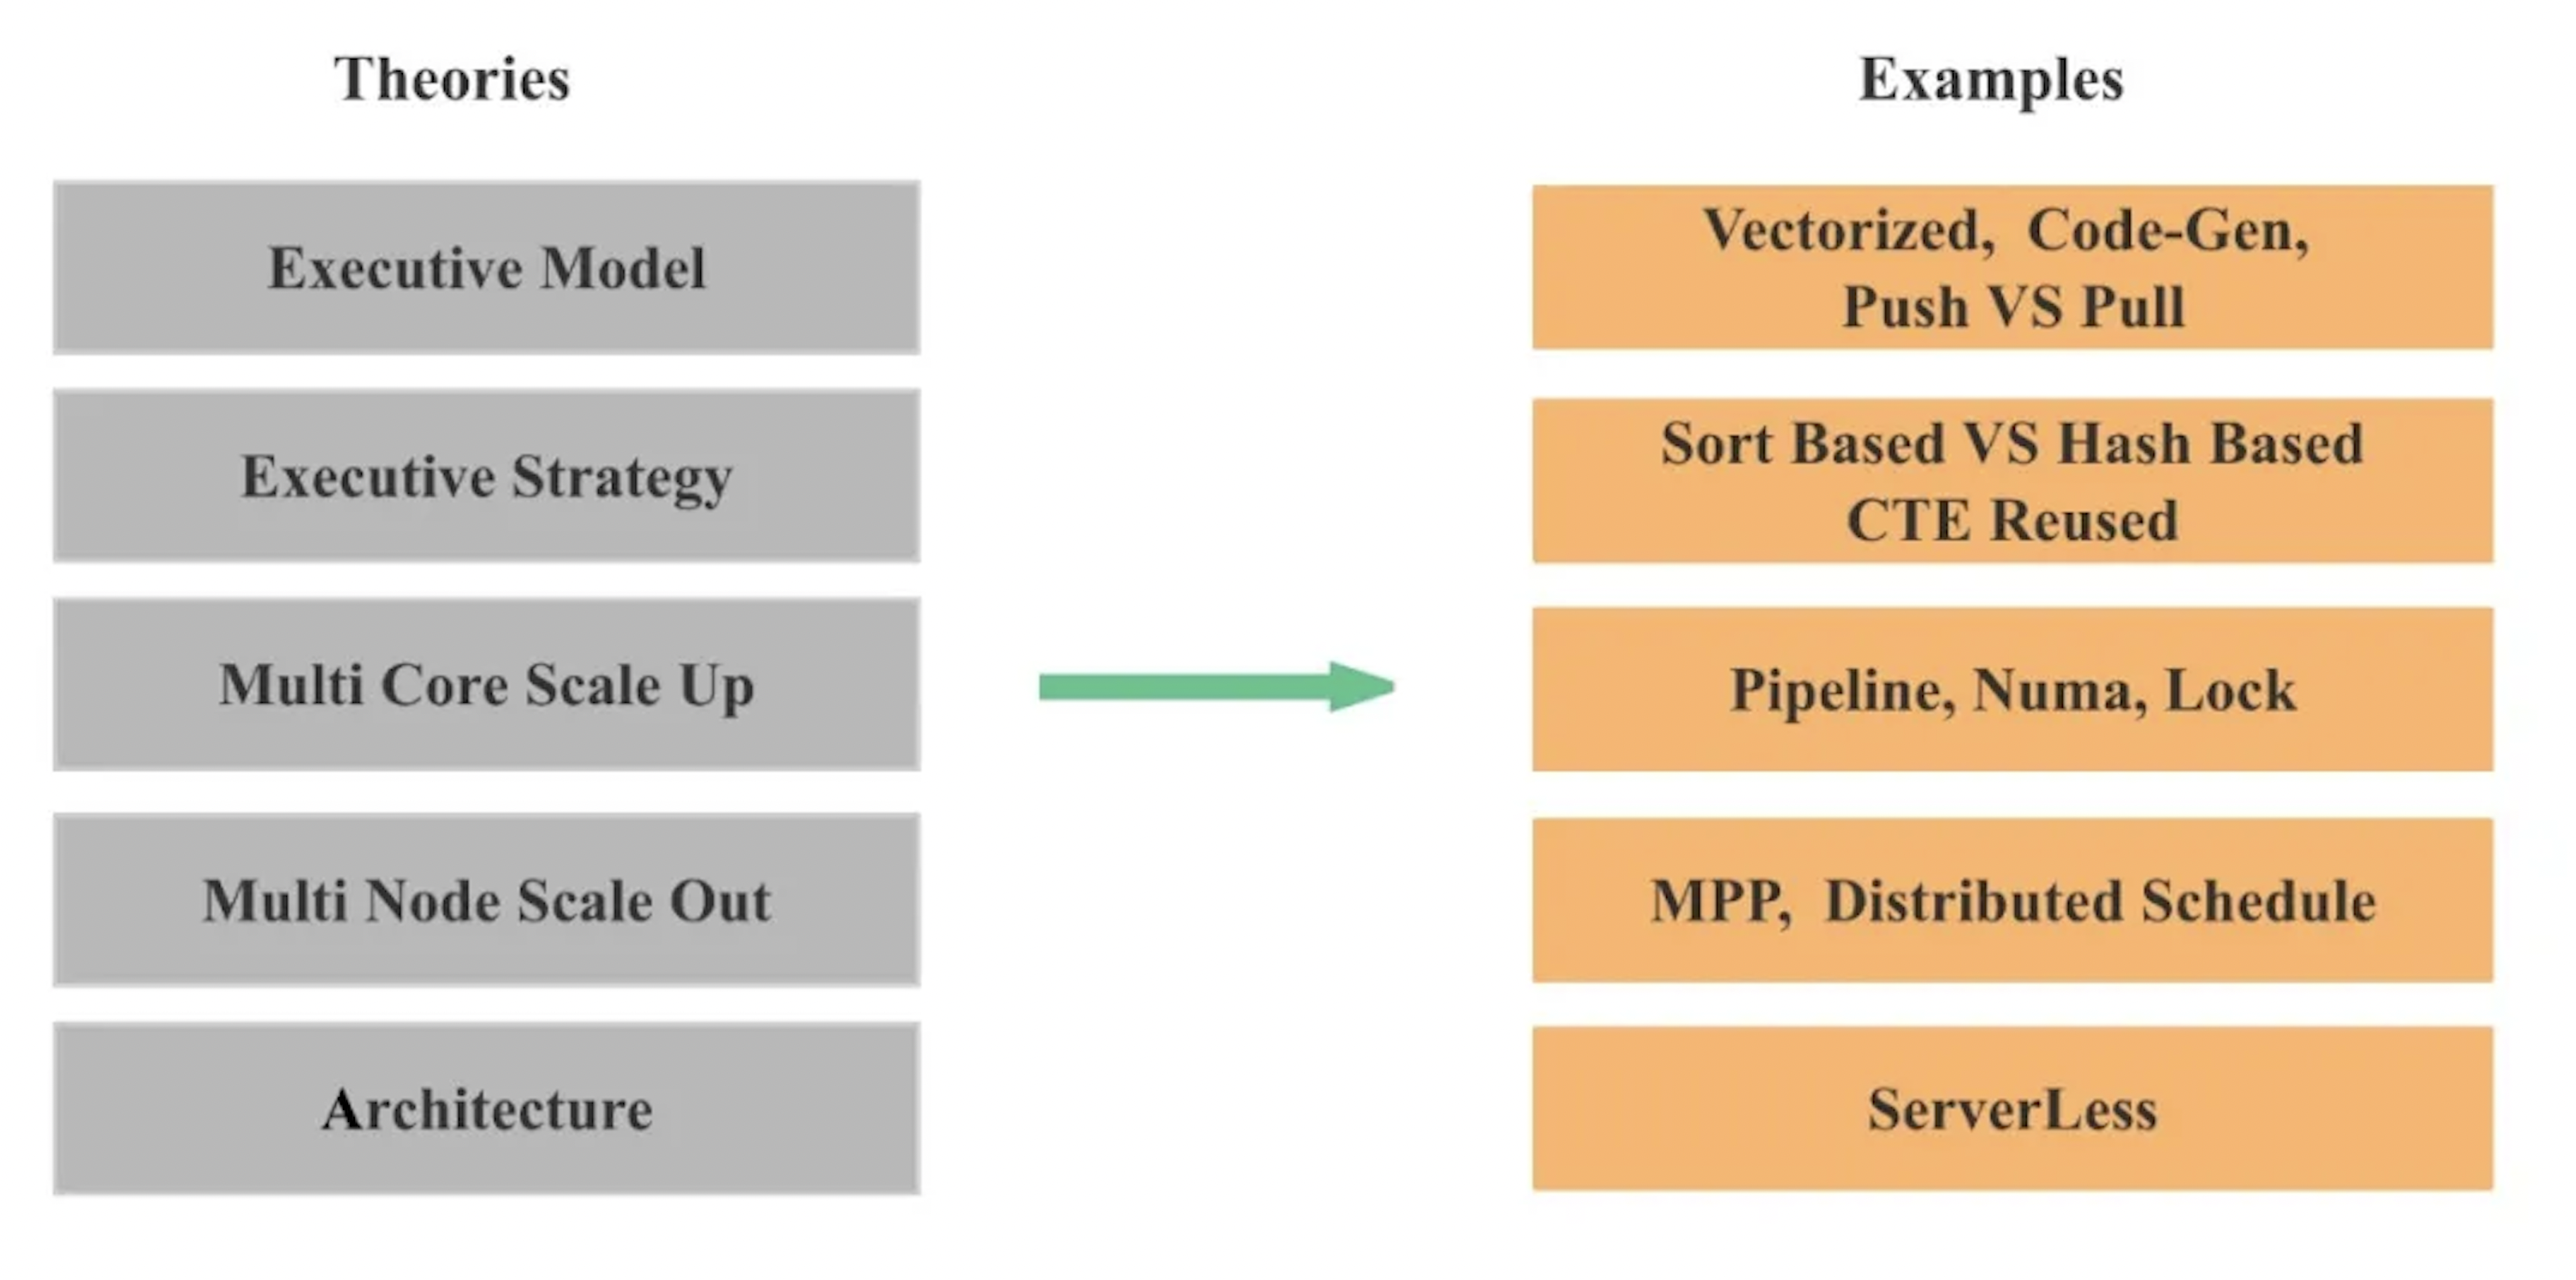
At the database level, performance optimization can be broadly divided into high-level and low-level optimizations. High-level optimizations focus on architectural and execution-design choices, including:
-
Architecture: For example, storage–compute separation versus integrated architectures, serverless designs, and distributed cache versus local cache.
-
Scale-out capability across nodes: Whether a query can effectively utilize resources across multiple machines, and whether query performance scales proportionally as more nodes are added.
-
Scale-up capability across CPU cores: Whether a query can fully leverage multi-core CPUs, and whether performance improves proportionally as the number of cores increases.
-
Execution strategies: For example, sort-based versus hash-based aggregation and joins, CTE reuse, and aggregation pushdown.
-
Execution model: Whether the engine supports vectorized execution, code generation, and whether execution follows a push or pull model.
4.4 Database Low-Level Optimization
This includes C++ language optimization, memory management, branch mispredicts, CPU cache, SIMD, and data structures and algorithms, which I will explore in detail in a separate article.
4.5 Optimizing from a Resource Perspective
At its core, performance optimization is about using system resources more efficiently. Most query optimization techniques ultimately aim to improve how the system consumes key resources such as CPU, memory, I/O, and network bandwidth:
-
Read less data, and read it faster at the storage layer, which primarily optimizes I/O resources
-
Transfer less data, and transfer it faster at the execution layer, which primarily optimizes network resources
-
Process less data, and process it faster at the execution layer, which primarily optimizes CPU and memory resources
When two solutions have the same algorithmic complexity, the better implementation is the one that does less unnecessary work and consumes fewer system resources.
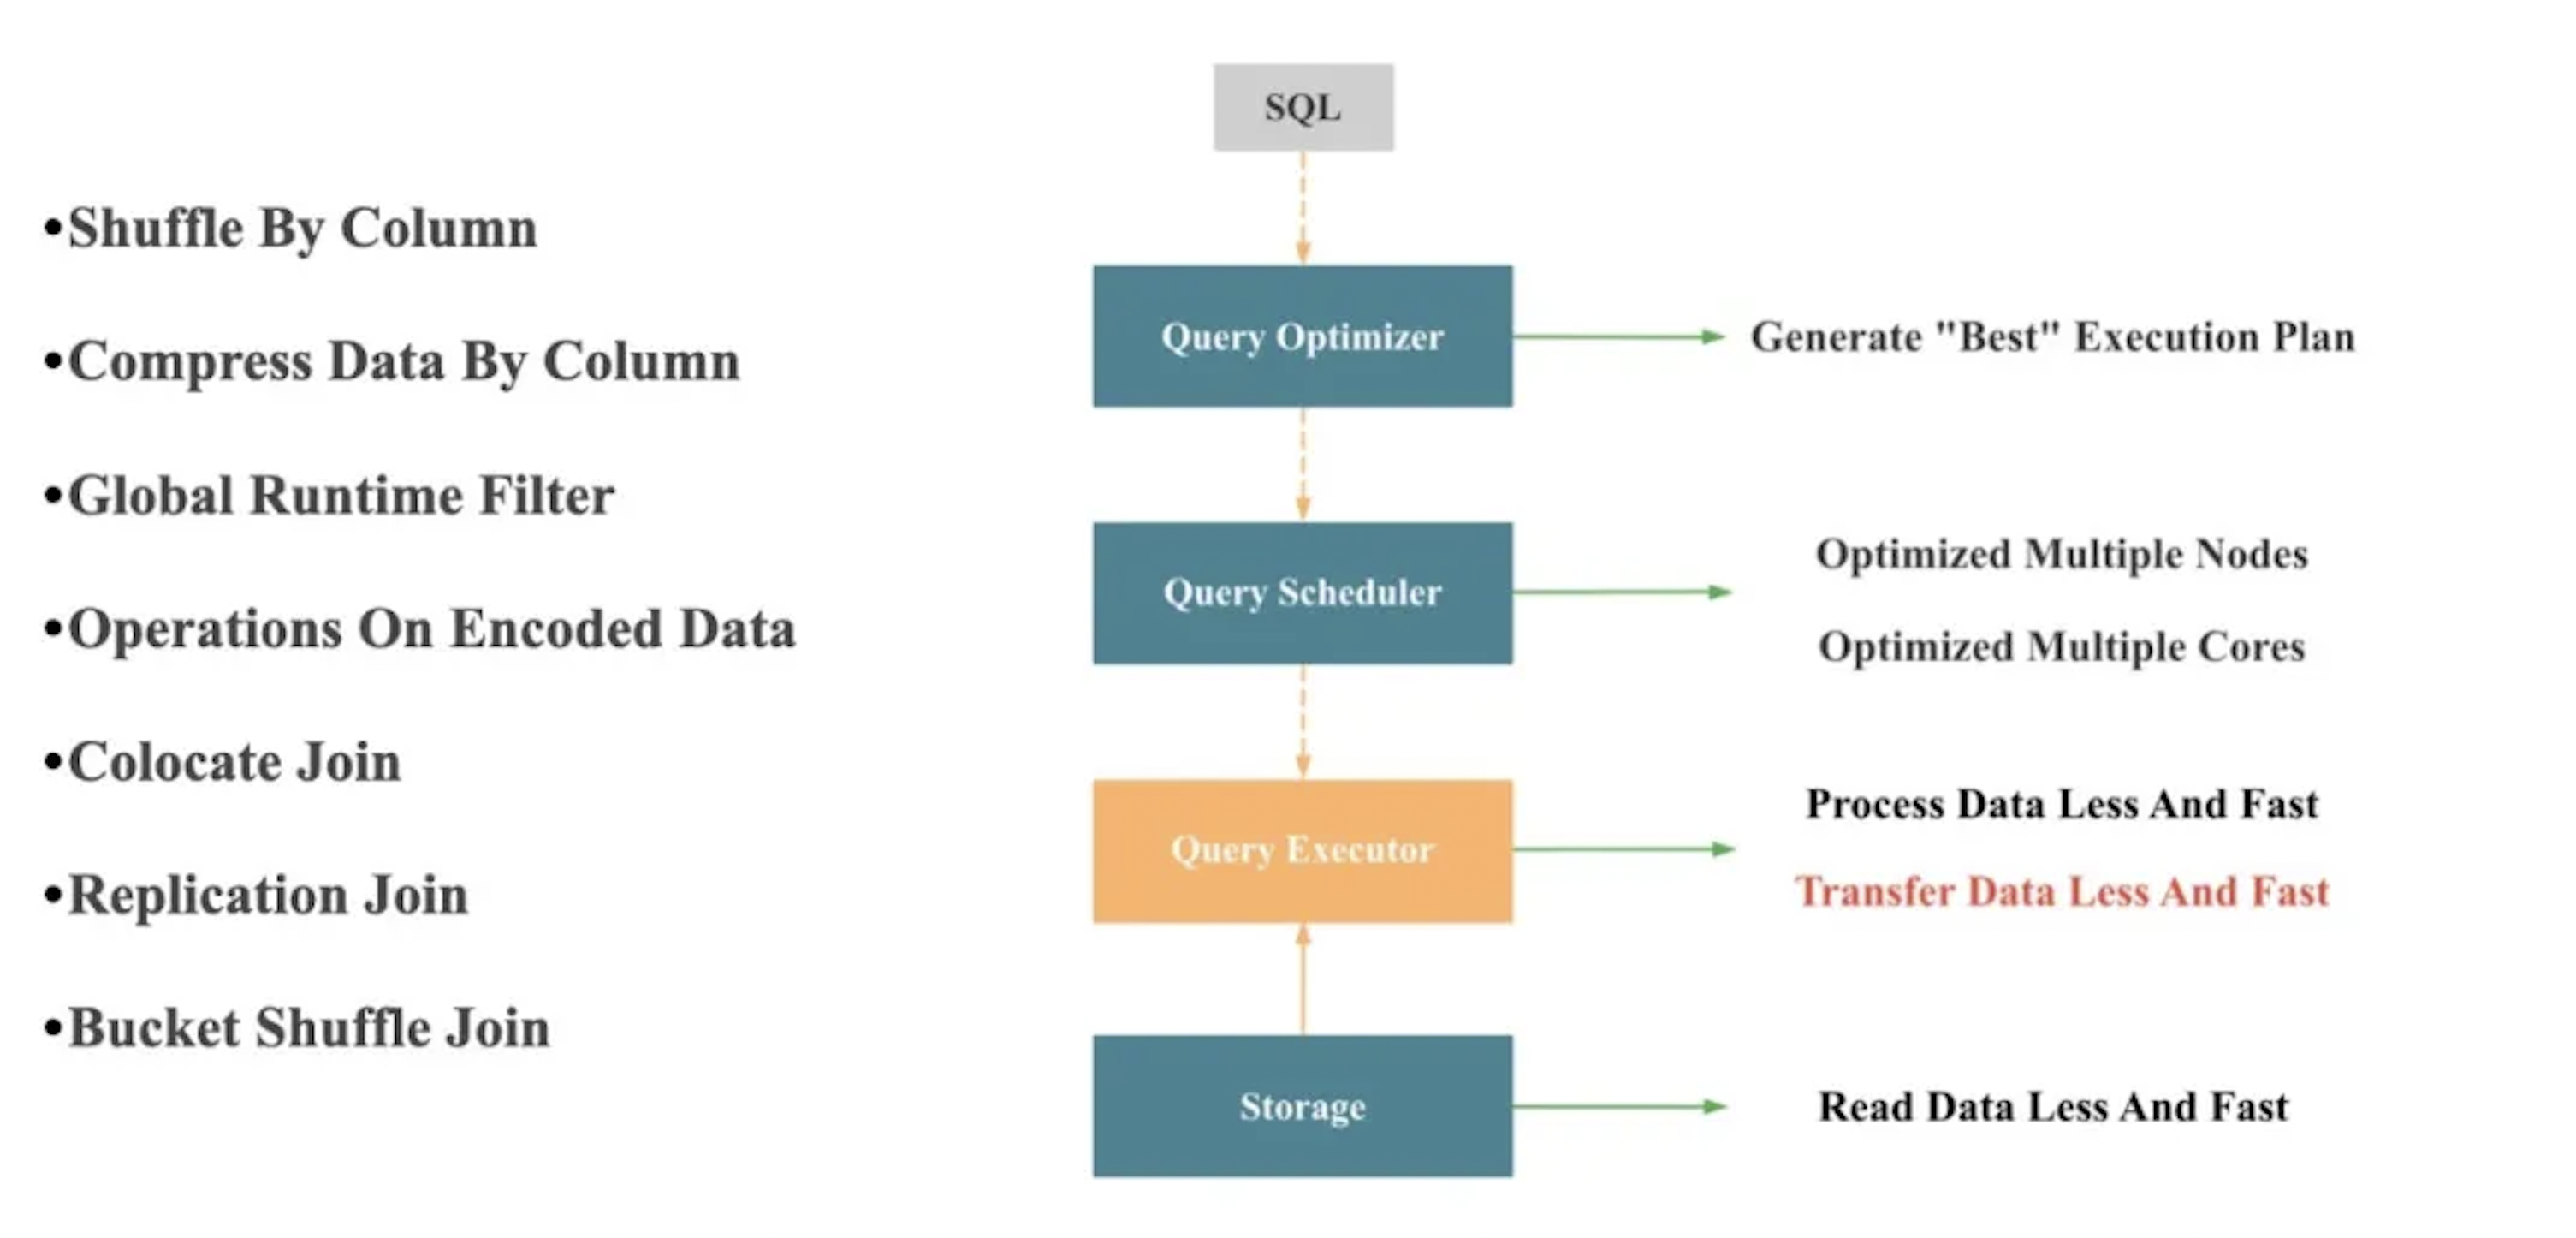
The figure above illustrates several execution-layer techniques for optimizing network usage during query processing.
5. How to Conduct Performance Testing Effectively
-
Ensure strict baseline consistency. Hardware, data, and test models must be aligned; otherwise, results are not comparable.
-
Test across different hardware environments, taking into account variations in core counts, storage media, and other system characteristics.
-
Evaluate both single-concurrency and high-concurrency performance, since real workloads stress systems in different ways.
-
Measure more than latency and throughput. Resource utilization must also be evaluated.
-
Avoid relying only on averages. P99 latency and jitter give a more accurate picture of system stability under load.
-
Include a broad set of representative workloads, not only the ideal or target scenario.
-
Make the testing process rigorous, repeatable, and automated, with careful attention to anomalies and proper standardization.
6. Is There an End to Database Performance Optimization on CPU Architectures?
The short answer is no. Performance optimization is an ongoing process, for several reasons:
-
Hardware continues to evolve. Changes in underlying hardware frequently drive architectural adjustments in database systems, along with new data structures and algorithmic improvements.
-
Database architectures continue to change. As architecture shifts, execution strategies, execution models, and optimization priorities must also adapt.
-
More context enables more optimization strategies. The more information we can gather about queries, data, and workload patterns, the more precisely we can optimize.
-
Data structures and algorithms keep advancing. Innovation never stops. Even a seemingly simple structure like a hash table has been refined continuously in industry for decades.
-
Execution strategies evolve as well. Techniques such as CTE reuse, aggregation pushdown, and various runtime filters are examples of ongoing improvements.
-
Systems are moving from manual tuning to adaptive behavior. Over time, more configuration options and session variables will be hidden from users. Removing each one often requires introducing new layers of adaptive execution.
7. Production Performance vs. Benchmark Performance
In controlled test environments, we work hard to eliminate noise so performance appears clean and predictable. Production systems, however, are far more complex. Achieving benchmark-level performance in a live environment often requires ten times more effort due to challenges such as:
-
Large queries slowing down small queries
-
Interference among ingestion, queries, compaction, and statistics tasks
-
Concurrency limits and query queuing
-
Timeouts and automatic retries
-
P99 latency becoming more important than simple averages
-
Slow or unhealthy nodes dragging down the whole cluster
-
Data skew causing uneven load and bottlenecks
In production, none of these problems is trivial—each one can become a major optimization project on its own.
8. Trade-offs in Performance Optimization
When deciding whether to pursue a particular optimization, it is important to weigh several factors, including code complexity, compatibility, and stability, as well as the cost–benefit ratio of the optimization, its general applicability, and the predictability of the resulting performance gains.
9. The Future of OLAP Database Performance Optimization
-
Cost-aware performance optimization in serverless architectures: Serverless brings tremendous flexibility but also new challenges in achieving consistent, cost-efficient performance. To balance speed and spend, several principles become critical:
-
Remove single-threaded bottlenecks across architecture, execution engines, and algorithms.
-
Ensure SQL queries scale linearly as nodes are added.
-
Address data skew so the entire cluster can be fully utilized.
-
-
Adaptive execution for real-world workloads: In real systems, data distributions, types, cardinalities, and correlations shift constantly. Because of this variability, no optimizer can reliably choose the best plan upfront. Adaptive execution, adjusting strategies dynamically at runtime, becomes not just helpful but essential.
-
AI-driven optimization using real workload history:AI opens the door to optimization strategies informed by actual usage patterns:
-
Batch workloads can use historical job data to guide smarter, history-aware planning.
-
Real SQL patterns and user behavior can feed models that predict and choose more effective execution strategies.
-
10. How to Grow into a Database Performance Optimization Expert
For anyone aiming to develop deep expertise in database performance optimization, here are a few practical recommendations:
-
Build strong fundamentals in CPU, memory, networking, and I/O — including principles, performance metrics, and profiling tools.
-
Develop a solid understanding of database system architecture and core concepts.
-
Gain hands-on proficiency with performance testing frameworks and methodologies.
-
Learn a broad range of optimization techniques across the database ecosystem.
-
Stay current with both academic research and industry innovations.
-
Keep pace with emerging hardware trends and architectural shifts.
-
Study the design principles and source code of the target system in depth.
At the end of the day, performance optimization is an engineering discipline; true insight comes from hands-on experimentation and continuous learning. Keep exploring, keep testing, and keep refining your intuition.
And of course, we welcome you to join the StarRocks community to learn, share, and grow with us!