✍🏼 About The Author:Hawk Liu, StarRocks Committer & Software Engineer at Celerdata
When evaluating database performance, engineers often face a fundamental challenge: how do you measure both speed and efficiency at the same time?
The Coffee-shop Benchmark [1] is an open test created by independent researchers to evaluate how different database systems perform and how much they cost under compute-intensive join and aggregation workloads. Its queries strike a good balance between real-world business relevance and computational complexity, making it a strong indicator of how analytical databases behave under practical workloads. Because of this, it has been widely used to compare systems like Databricks, Snowflake, and ClickHouse [2–6].
The benchmark simulates common retail analytics scenarios such as sales trends, profit analysis, and discount strategies, offering a well-rounded view of execution performance and resource usage.
Out of research interest and for engineering validation, we reproduced all 17 queries of the Coffee-shop Benchmark [1,4] under the same testing logic and instance specifications, and completed validations on StarRocks using datasets of 500M, 1B, and 5B rows.
Across these join-heavy, high-cardinality workloads, StarRocks consistently ran faster and at lower cost, delivering roughly 2–10× improvements in performance and cost efficiency over the reference systems.
These results highlight StarRocks’ strengths in operator optimization, vectorized execution, and resource scheduling—and show that in scenarios like ad attribution, user profiling, and real-time dashboards, organizations can achieve faster analytics with fewer resources.
For developers and architects optimizing for real-time performance and cost, this benchmark offers an objective, reproducible point of comparison—and further underscores StarRocks’ cost-efficiency advantages in a Lakehouse architecture.
Dataset Characteristics
The Coffee-shop Benchmark dataset consists of one fact table (
fact_sales) and two dimension tables (dim_locations, dim_products):-
Dimension tables: Row counts are fixed and do not change with scale.
-
dim_locations: 1,000 rows -
dim_products: 26 rows
-
-
Fact table: The row count of
fact_salesvaries by scale.-
500M scale: 0.72B rows
-
1B scale: 1.44B rows
-
5B scale: 7.2B rows
-
The Coffee-shop Benchmark covers two typical join patterns found in analytical workloads:
Equality Join
fact_sales joins with dim_locations on the location_id column. This column is of type VARCHAR, which effectively tests a system’s parallel execution and data-shuffling efficiency under large-scale distributed joins.Range Join
fact_sales joins with dim_products on the name column with an additional time-range filter:f.order_date BETWEEN p.from_date AND p.to_dateThis pattern is common in real-world scenarios (e.g., product dimension tables with validity periods) and evaluates how well the system optimizes and executes complex join predicates.
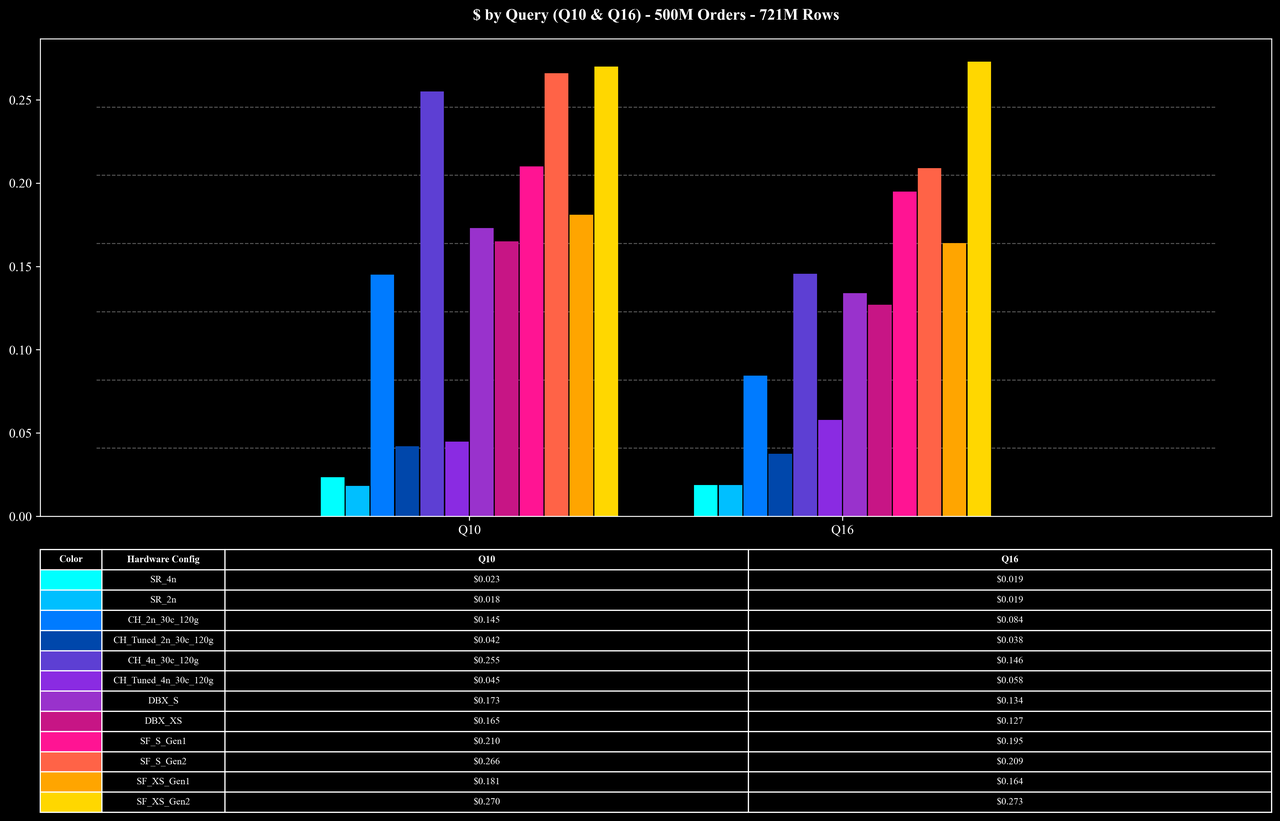
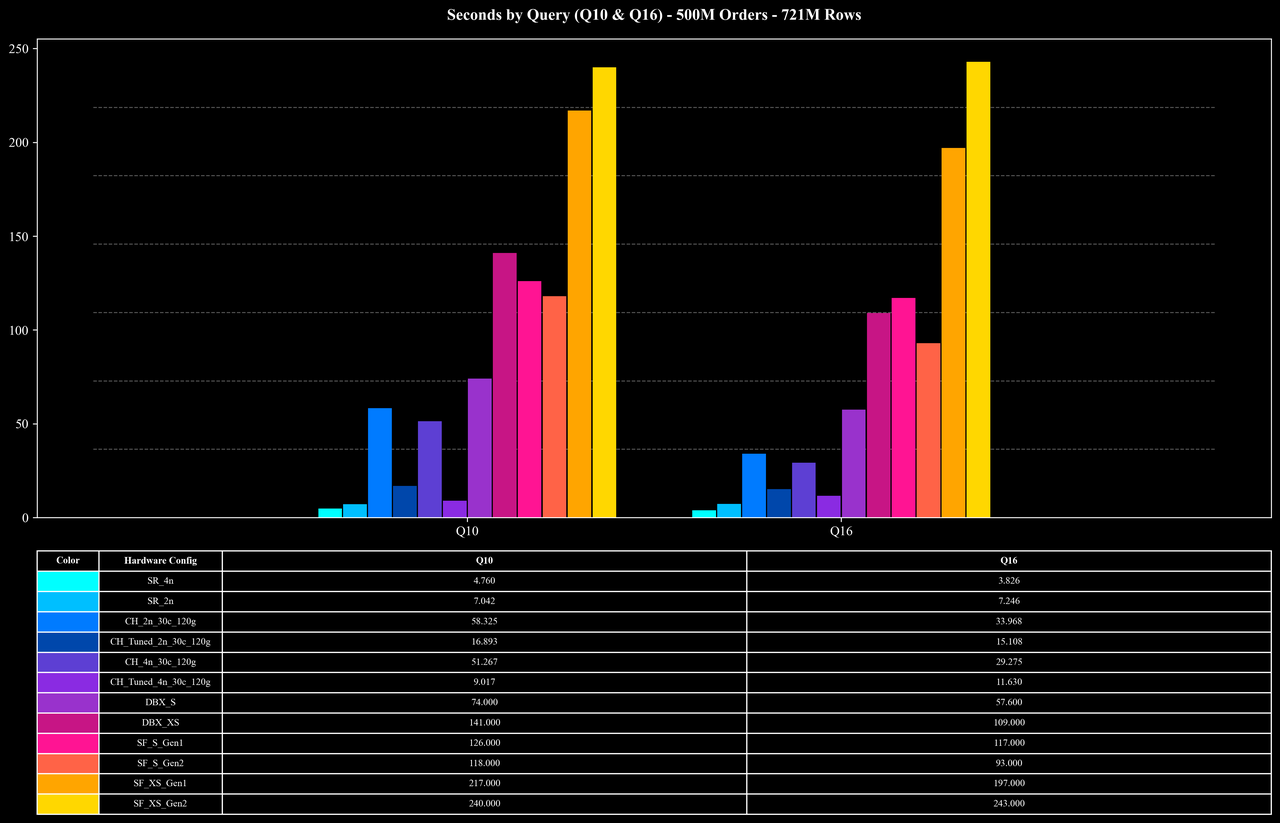
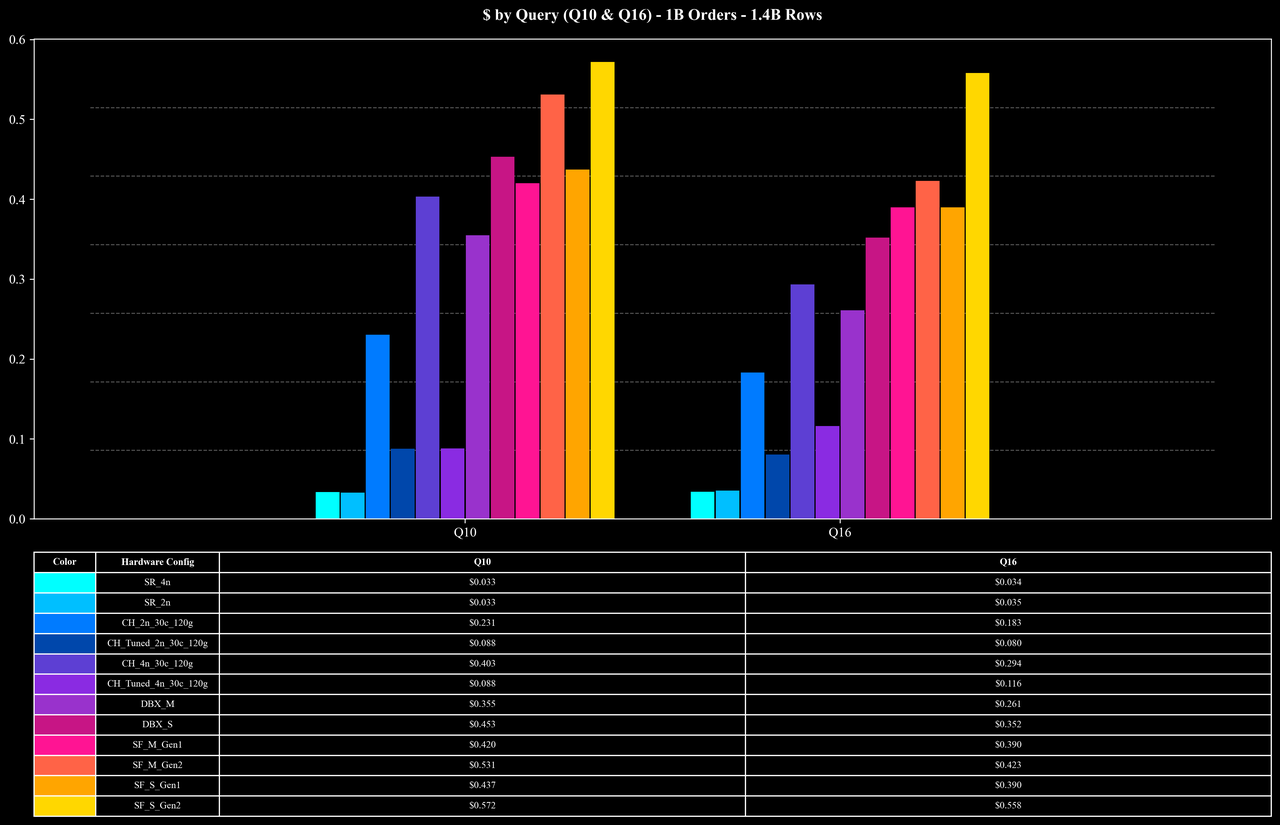
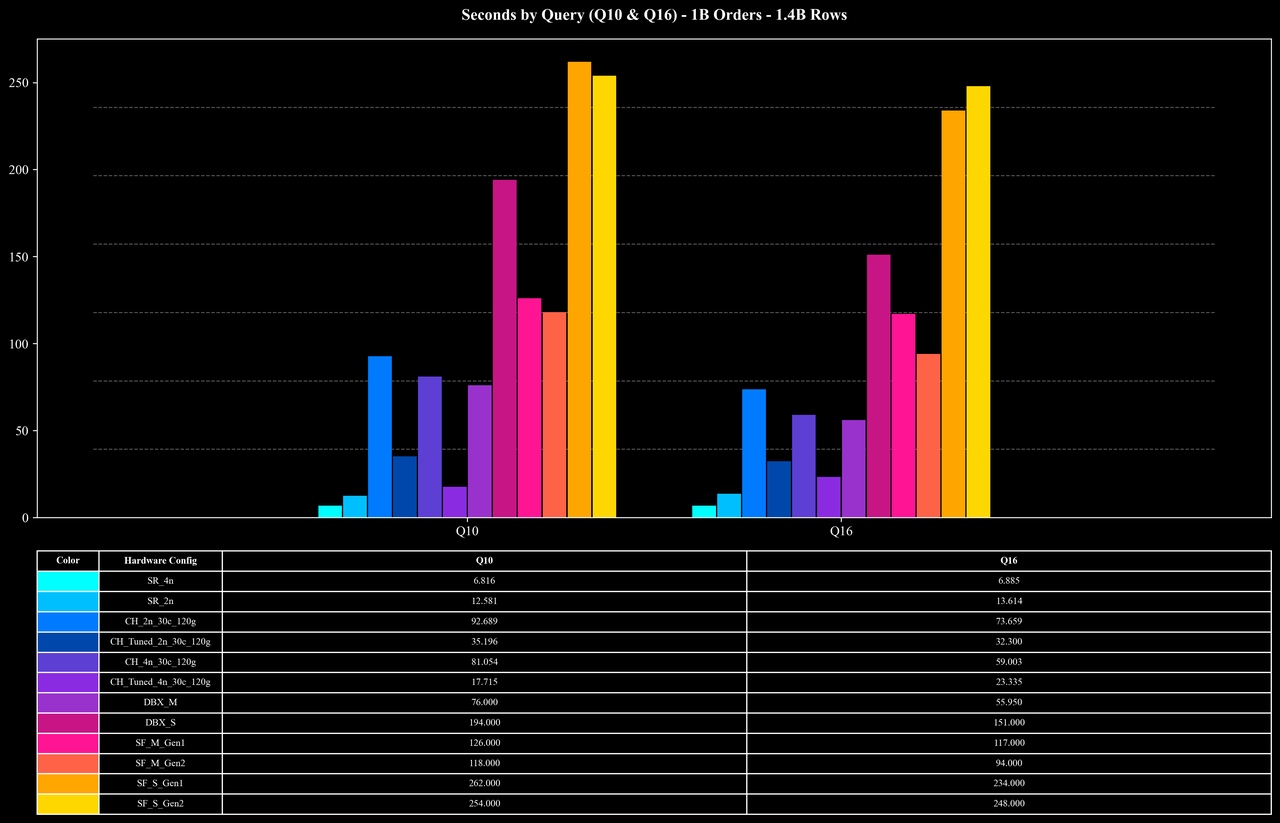
Beyond joins, the 17 queries also span a wide range of aggregation patterns. They include multiple aggregate functions—such as COUNT DISTINCT—and perform GROUP BY on different column combinations. Among them, Q10 and Q16 are the most challenging: they compute
COUNT(DISTINCT order_id) and group on multiple columns. Because order_id has extremely high cardinality (each key appears, on average, fewer than two times), these queries place significant pressure on intermediate aggregation, deduplication, and memory management.In these large-scale join and high-cardinality aggregation workloads, StarRocks maintains strong performance and resource efficiency through the combined effect of its optimized hash map implementation, multi-stage aggregation, join runtime filters, low-cardinality dictionary optimizations, and other execution enhancements.
Test Environment
To ensure comparability with prior studies, we adopted instance configurations and data distribution strategies similar to earlier research:
-
Instance Configuration
-
FE Node: 1 × m7g.2xlarge (8 vCPUs, 32 GB memory), responsible for query parsing, plan generation, scheduling, and result returning.
-
BE Nodes: m7g.8xlarge (32 vCPUs, 128 GB memory), responsible for query execution.
-
500M scale: 2 or 4 instances
-
1B scale: 2 or 4 instances
-
5B scale: 8 or 16 instances
-
-
-
Table Distribution Strategy: The test used Order Key and Hash Bucket Key distribution. Detailed DDL, data-loading scripts, and query execution scripts are provided in Coffee Shop Benchmark on StarRocks. The original benchmark includes both clustered and non-clustered layouts; to maintain consistency, we report only the results from the clustered layout.
-
Data Loading: We used the Coffee-shop dataset published by ClickHouse [4]. Thanks to StarRocks’ compute–storage separation, the dataset only needs to be loaded once and can be reused across different compute configurations. Scale-in/scale-out tests can be conducted simply by adjusting the number of compute nodes—no need to reload the data.
-
Query Statements: All 17 queries from the original Coffee-shop Benchmark were reproduced exactly, with only minor syntax adjustments (e.g., replacing unsupported
CREATE OR REPLACE TABLEsyntax) while preserving identical semantics and logic. -
StarRocks Version: Tests were based on StarRocks 4.0.1. Aside from default configurations, we only collected joint statistics for
(order_date, location_id)in thefact_salestable to help the optimizer generate better plans; all other parameters remained at their defaults.
Test Methodology
Each query was executed five times, and the shortest runtime was taken as the warm-cache performance result.
Results from comparison systems (ClickHouse, Snowflake, Databricks) were taken from publicly available studies and blog posts [2–6], and compared under the same data scales (500M, 1B, 5B) to evaluate overall runtime and cost efficiency.
Test Results
500M Scale (0.72B Rows)
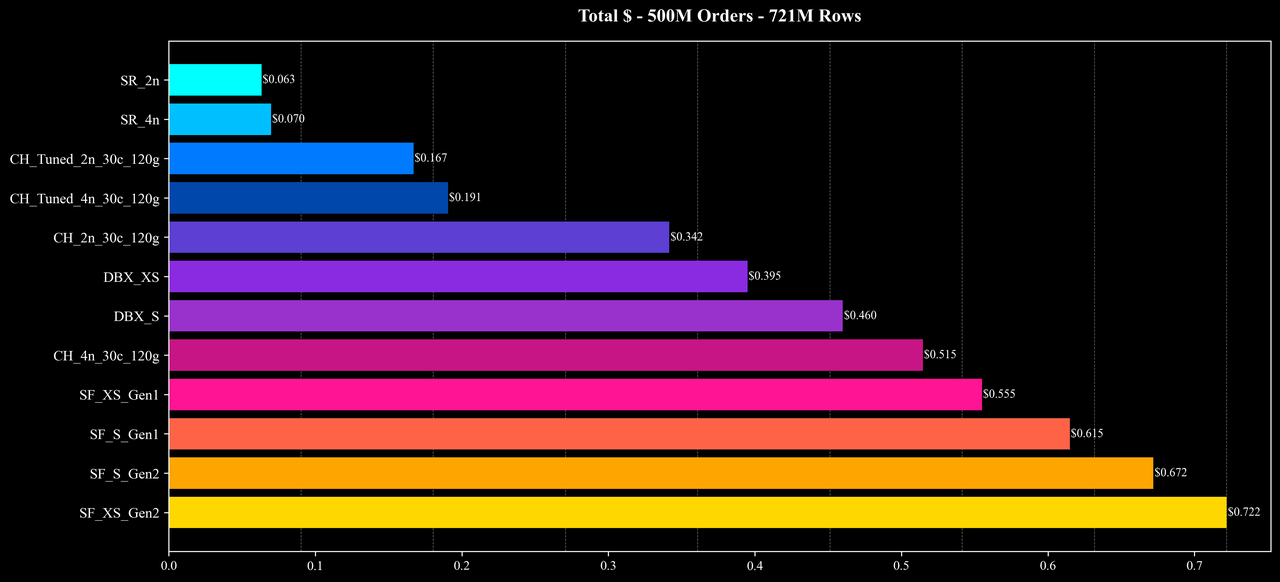
Total Cost
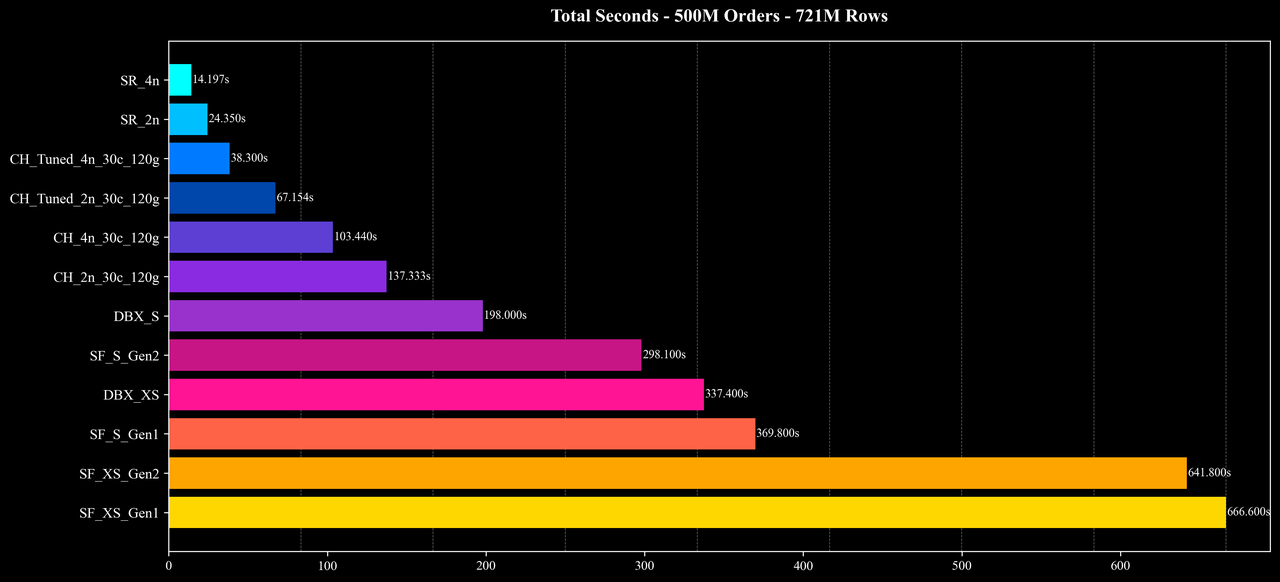
Total Runtime
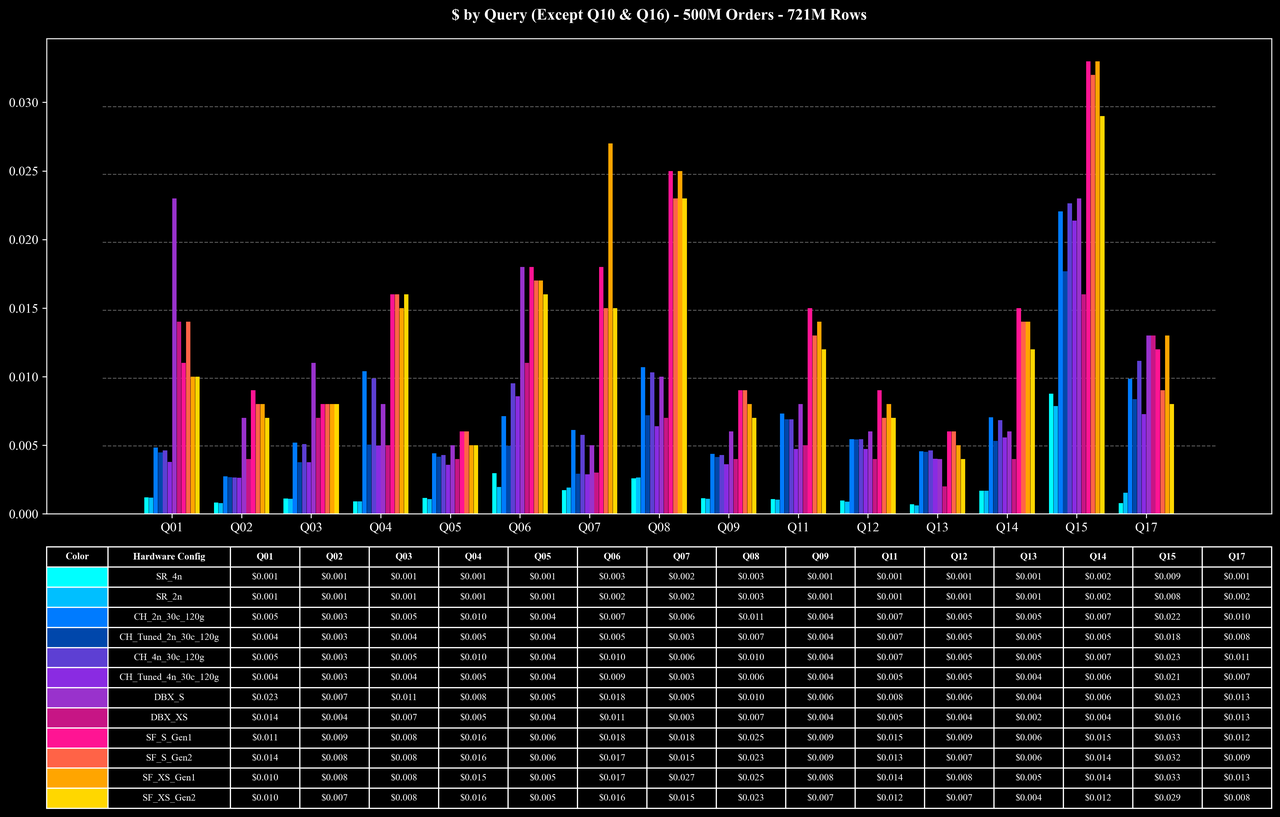
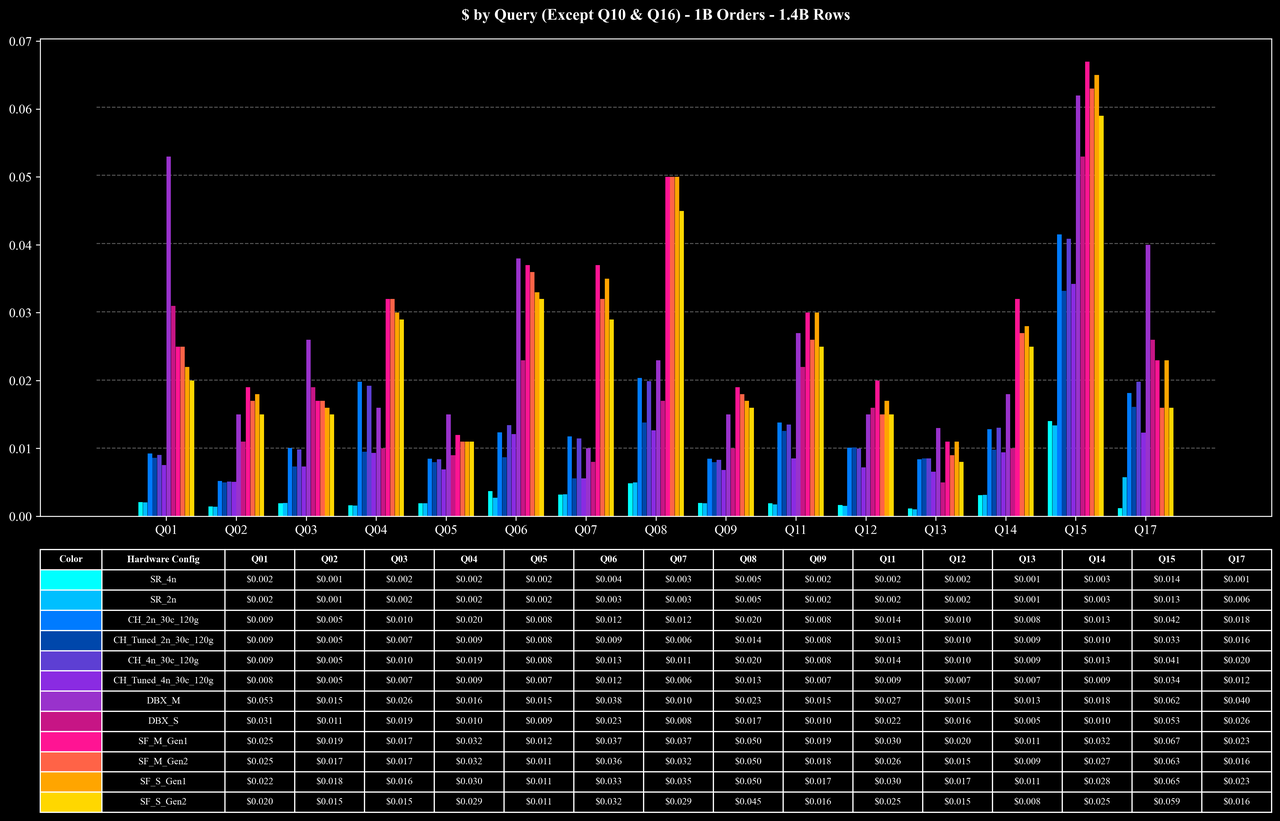
Cost per Query (Except Q10 & Q16)
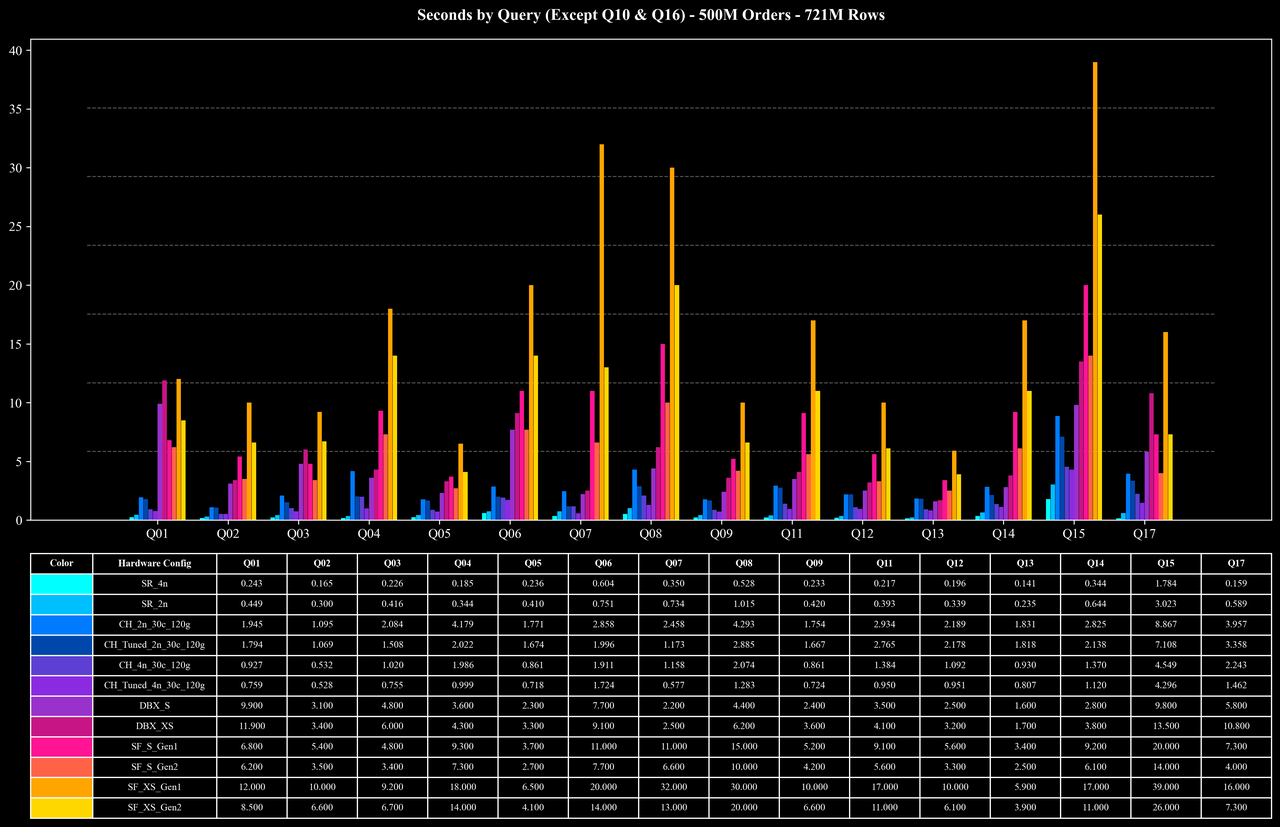
Runtime per Query (Except Q10 & Q16)
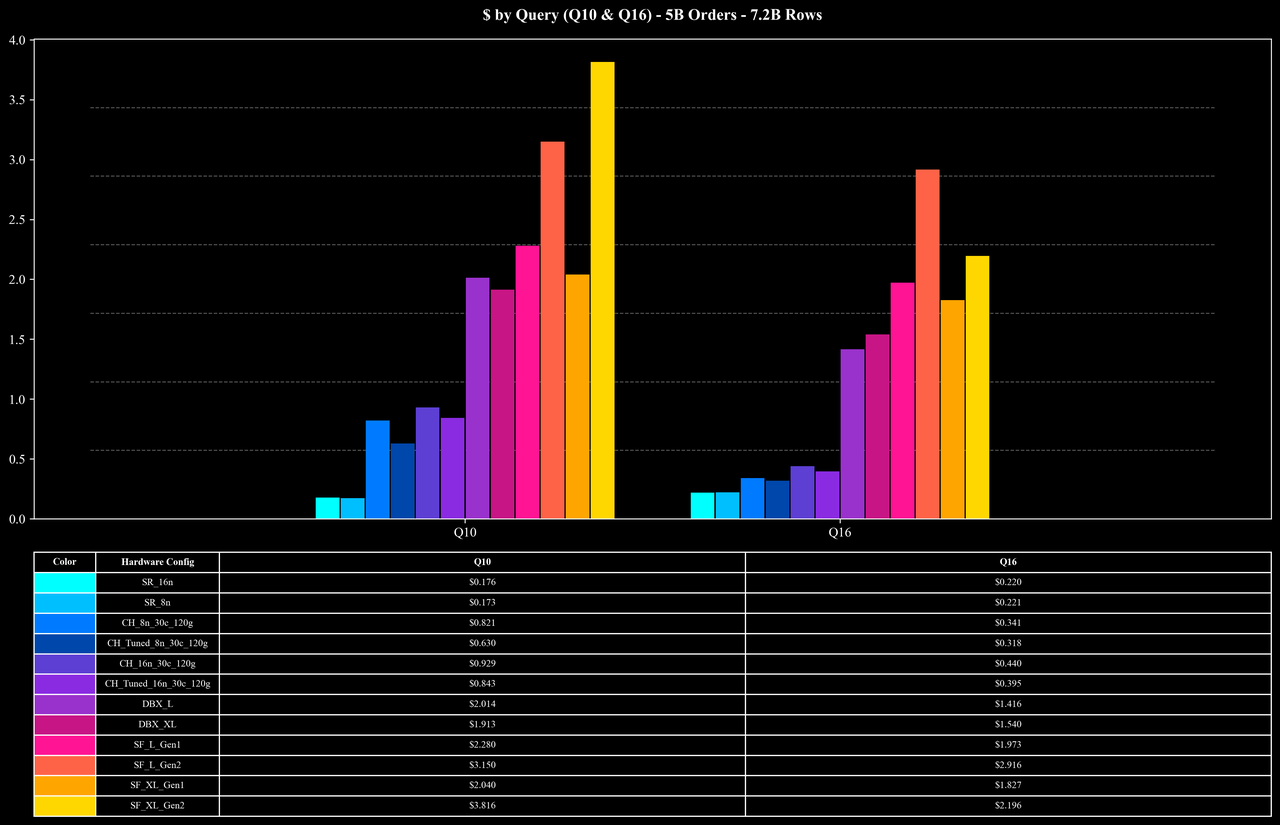
Cost per Query (Q10 & Q16 Only)
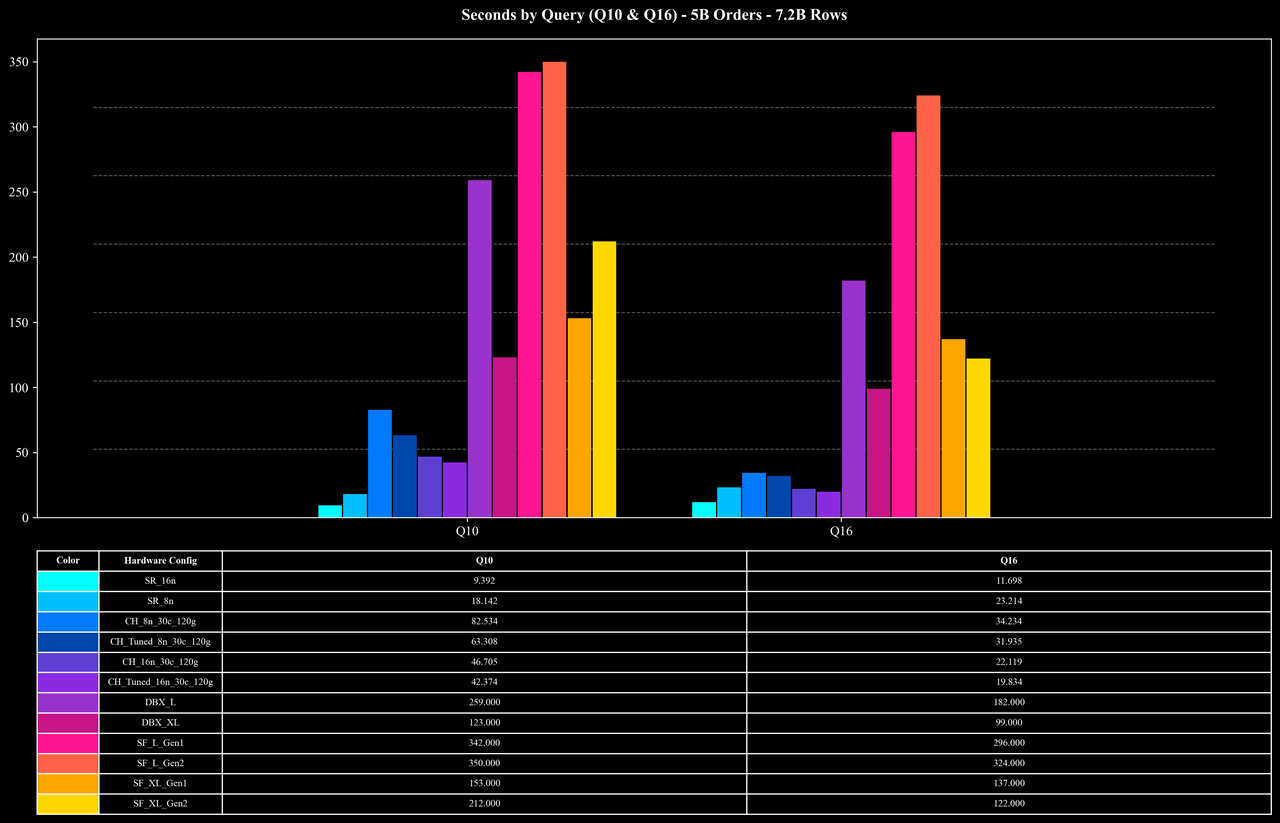
Runtime per Query (Q10 & Q16 Only)
1B Scale (1.44B Rows)
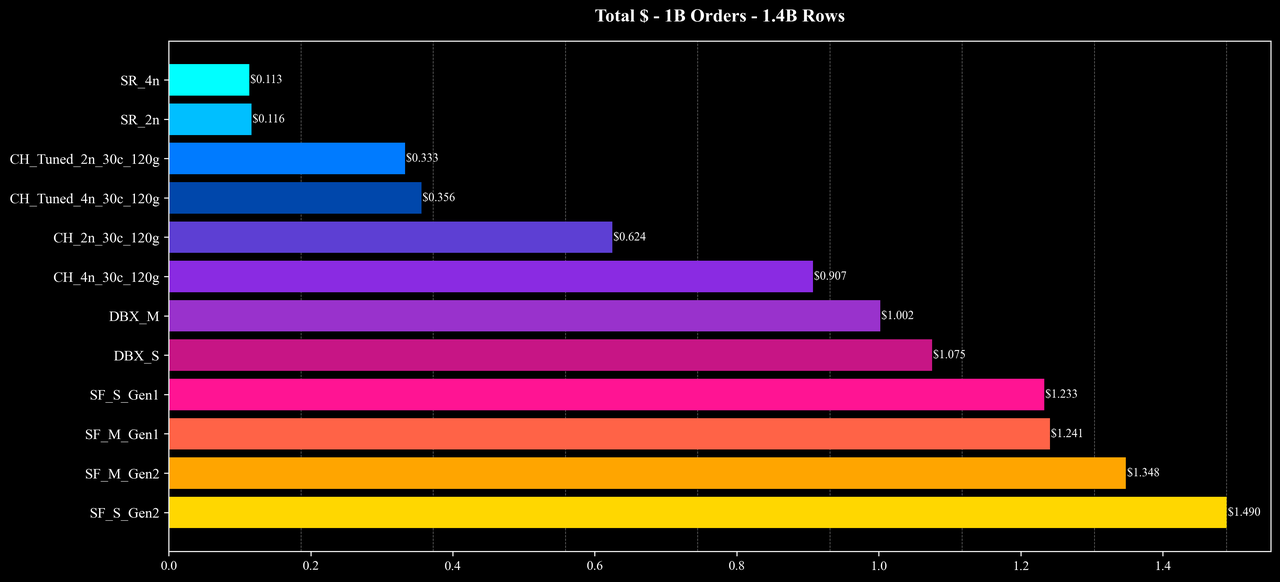
Total Cost
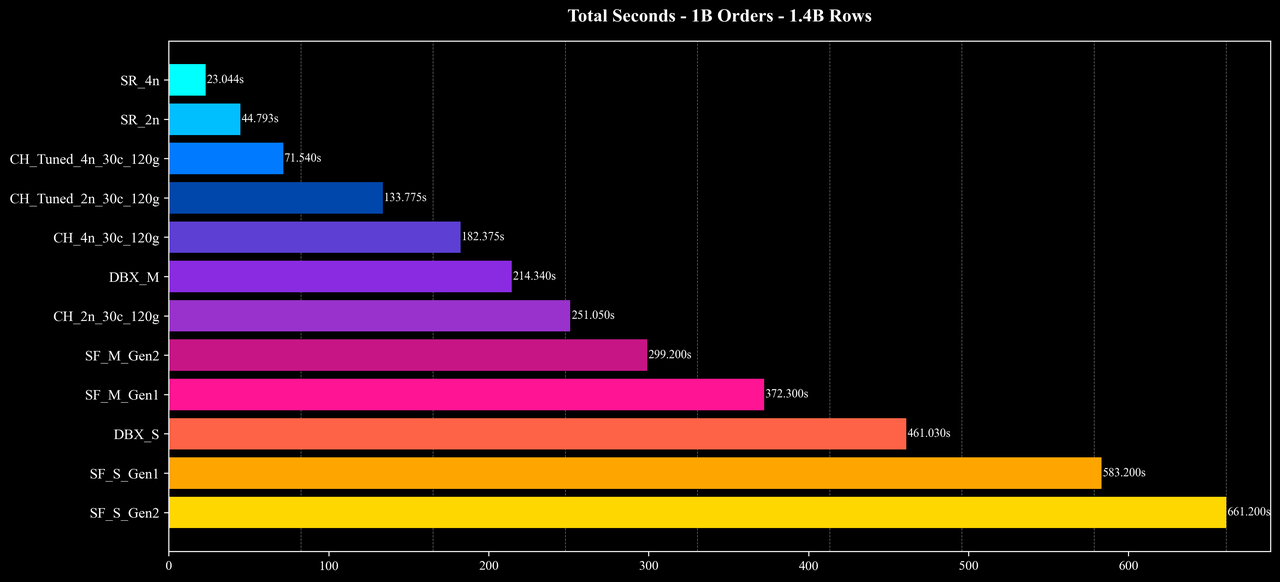
Total Runtime
Cost per Query (Except Q10 & Q16)
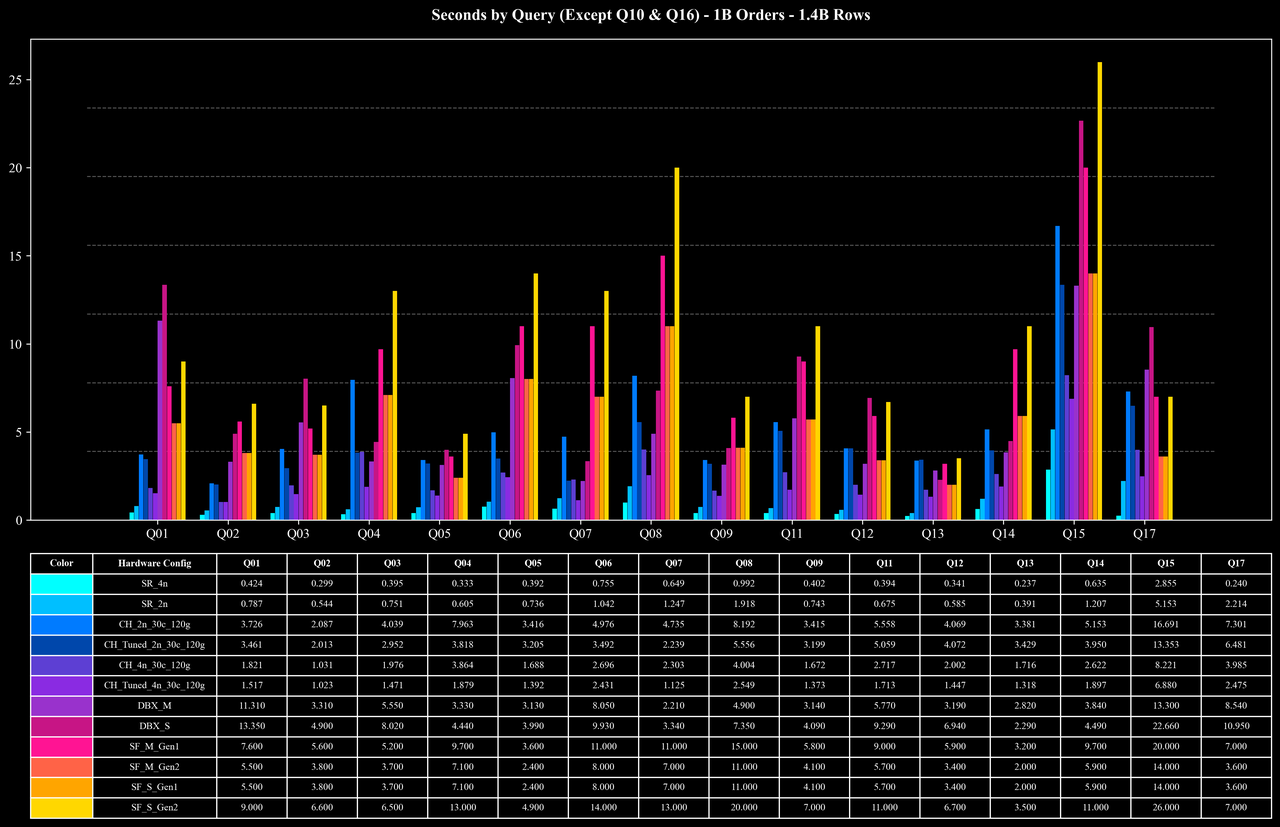
Runtime per Query (Except Q10 & Q16)
Cost per Query (Q10 & Q16 Only)
Runtime per Query (Q10 & Q16 Only)
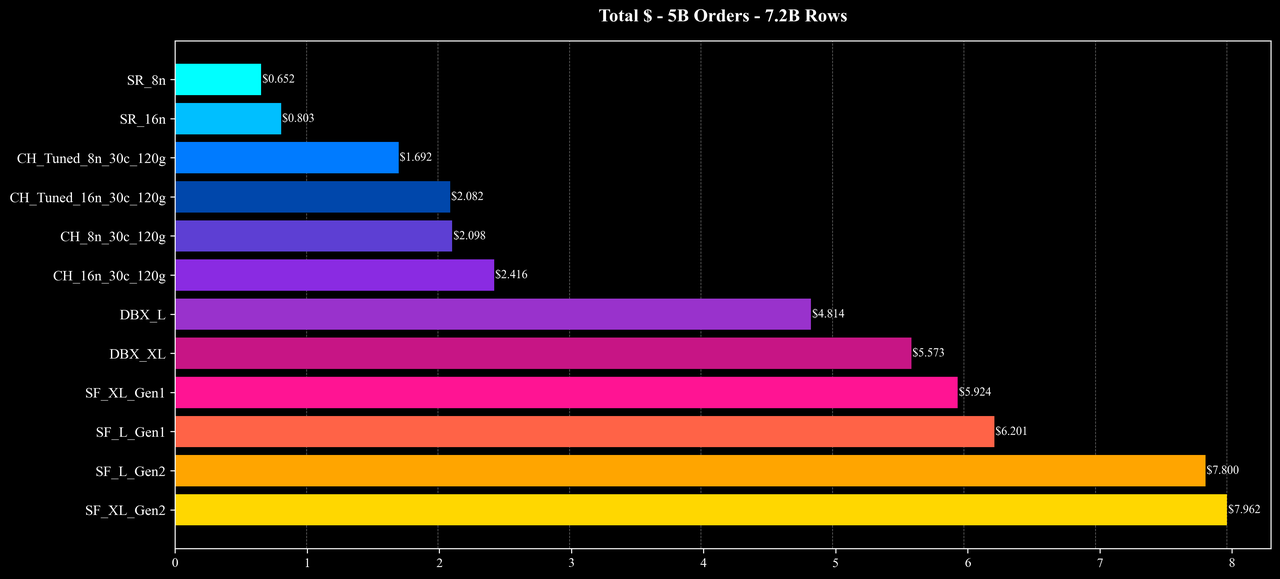
5B Scale (7.2B Rows)
Total Cost
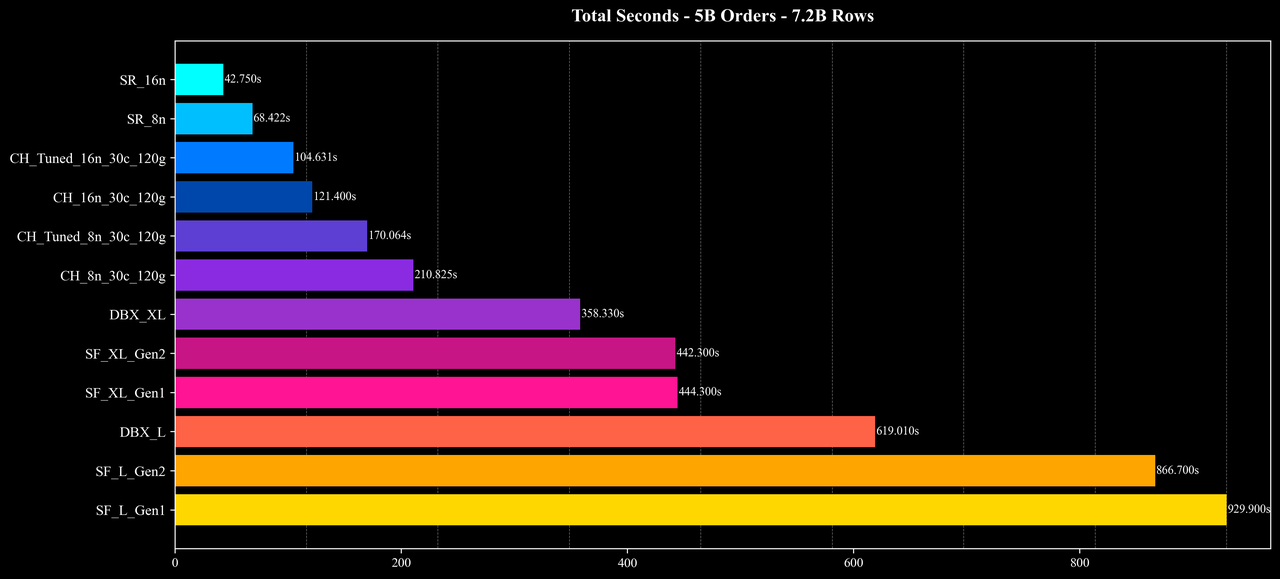
Total Runtime
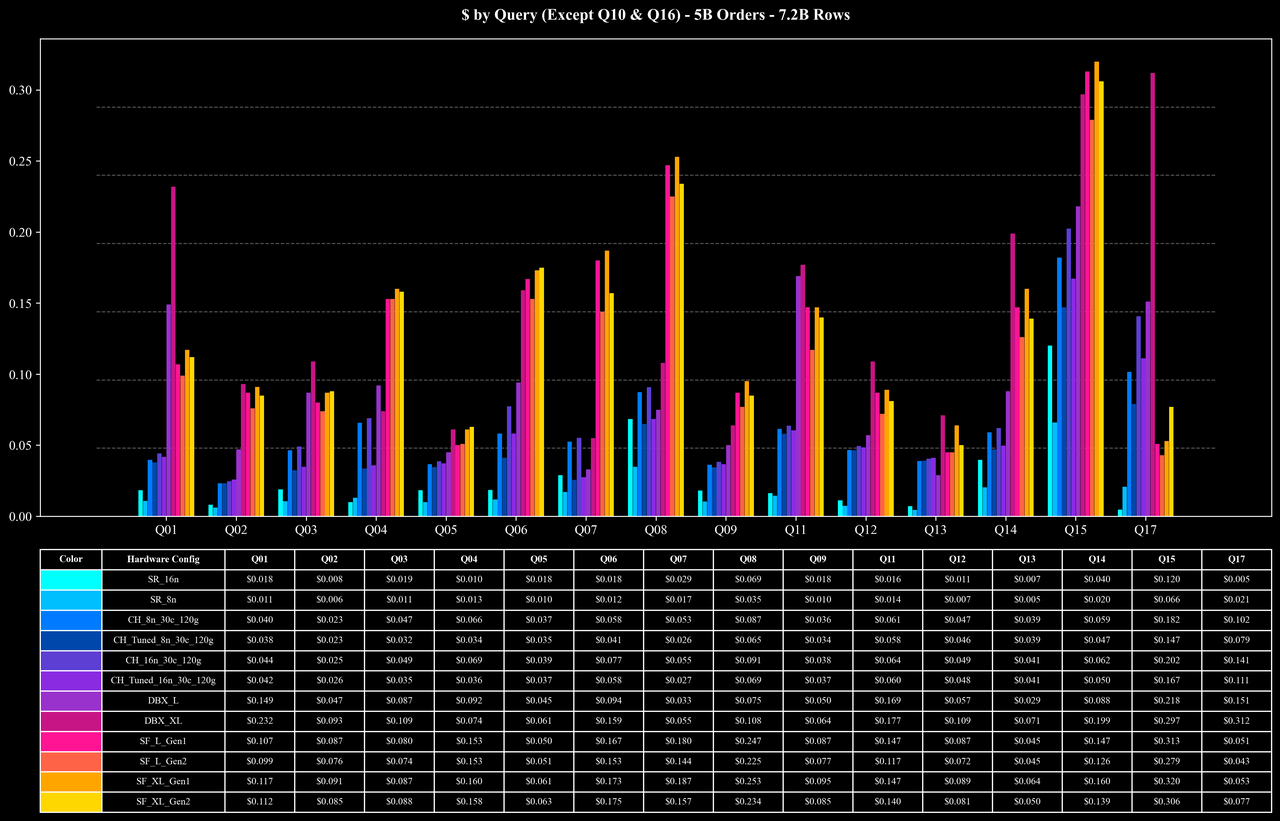
Cost per Query (Except Q10 & Q16)
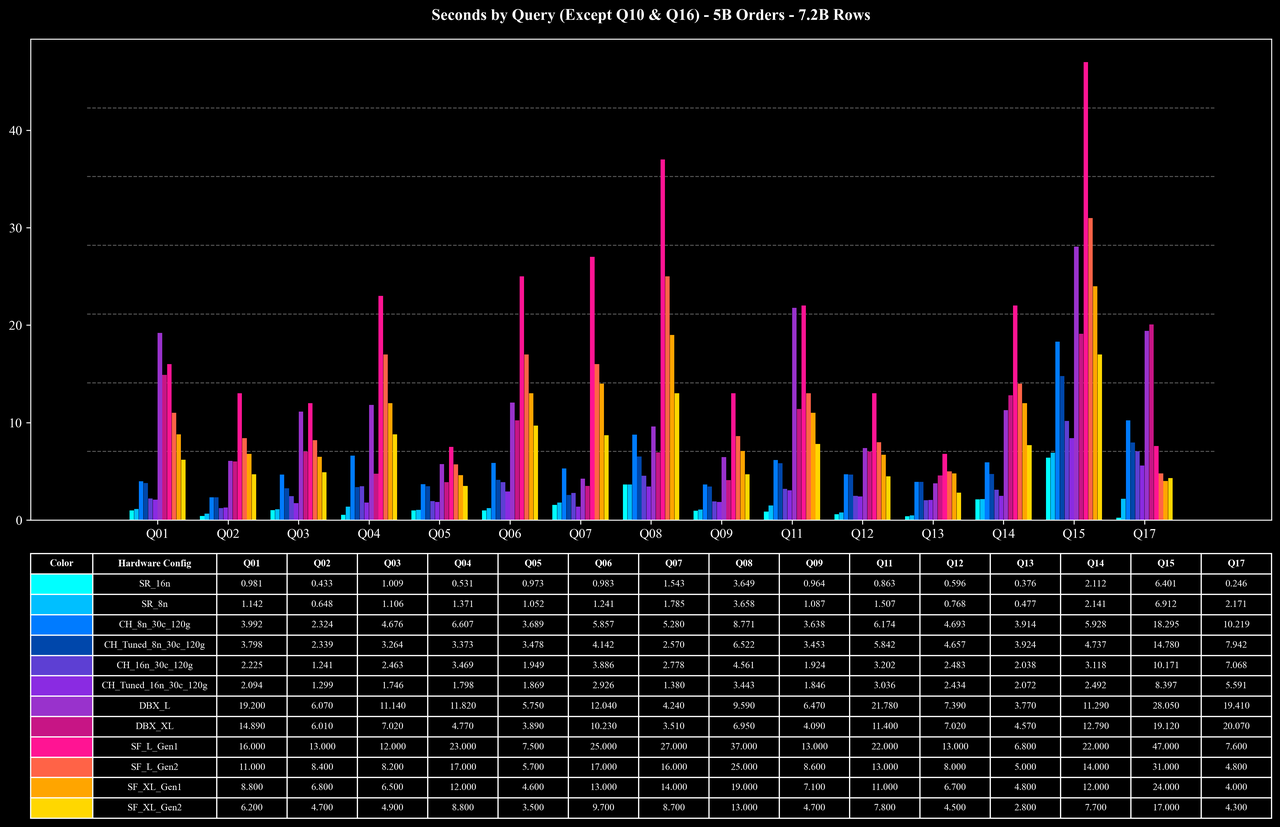
Runtime per Query (Except Q10 & Q16)
Cost per Query (Q10 & Q16 Only)
Runtime per Query (Q10 & Q16 Only)
Results Analysis
The Coffee-shop Benchmark includes 17 queries covering joins, aggregations, window functions, sorting, and other complex operations. Among these, joins and aggregations are the primary performance bottlenecks for most queries.
Across the 500M, 1B, and 5B data scales, StarRocks demonstrates strong linear scalability and resource efficiency:
-
Most queries: At the 500M and 1B scales, average query latency is around 0.5 seconds, and even at the 5B scale, most queries still complete in roughly 1 second, showing stable performance and good scalability.
-
Heavy-load queries (Q10, Q16): Even for join + high-cardinality COUNT DISTINCT workloads on 7.2B rows, StarRocks completes these queries in about 10 seconds at the 5B scale—significantly reducing execution overhead.
-
Overall performance and cost: Under similar hardware configurations and identical data scales, StarRocks delivers superior performance and cost efficiency, achieving substantial improvements in both speed and resource savings across most scenarios.
These results show that StarRocks can fully utilize multi-node compute resources under complex analytical workloads and maintain a strong balance of performance and cost—even in join-heavy and high-cardinality aggregation queries.
Additional Notes and Extended Testing
It’s worth noting that the dimension tables in the Coffee-shop Benchmark are relatively small (26 rows and 1,000 rows), as the benchmark is primarily designed to evaluate fact-table–centric analytical workloads.
In more complex and industry-standard benchmarks—such as TPC-DS—StarRocks also delivers stable performance in high-load scenarios involving multi-table joins and large-scale aggregations, consistently demonstrating an excellent balance of speed and cost efficiency.
For more detailed results, see 👉 StarRocks TPC-DS Benchmark.
References
Want to discover more real-world StarRocks analytics use cases? Join StarRocks’ Slack channel to learn more.